Figure 1.
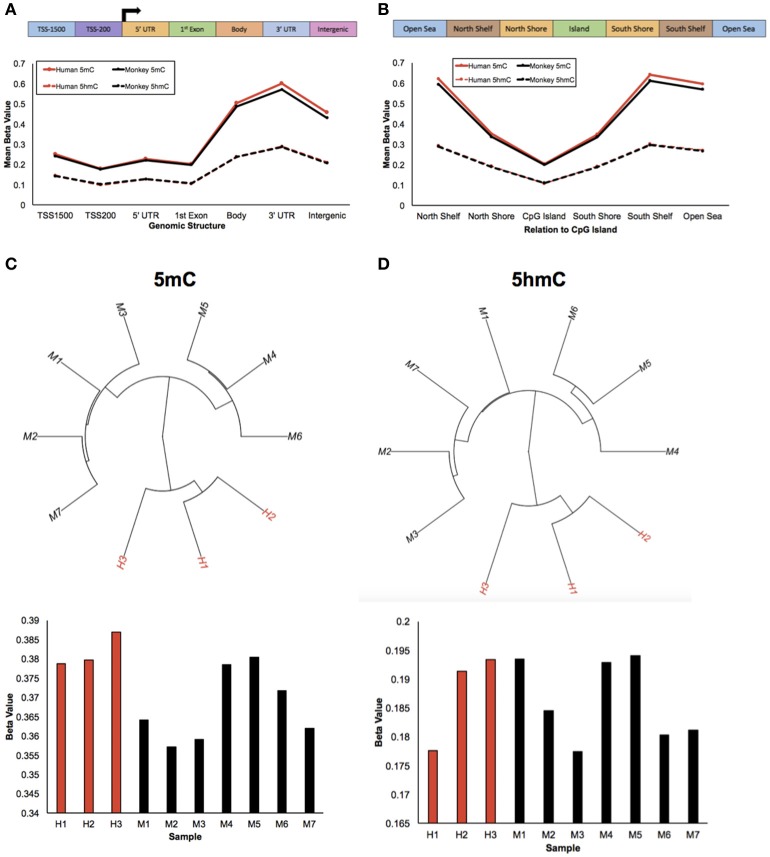
Humans and monkeys exhibit similar 5 mC and 5 hmC abundance trends. (A) Schematic of the standard genomic structures: 1,500 bp upstream of the transcription start site (TSS1500); 200 bp upstream of the transcription start site (TSS200); 5′ UTR; 1st exon; gene body; 3′ UTR; intergenic regions (top panel). Line plot of the mean beta value (y-axis) of 5 mC abundance from humans and monkeys (solid red and black lines, respectively) and 5 hmC abundance from humans and monkeys (dashed red and black lines, respectively) across standard genomic structures (x-axis; bottom panel). (B) Schematic of the structures in relation to CpG islands: North Shelf, North Shore, CpG Island, South Shore, South Shelf, Open Sea (top panel). Line plot of the mean beta value (y-axis) of 5 mC abundance from humans and monkeys (solid red and black lines, respectively) and 5 hmC abundance from humans and monkeys (dashed red and black lines, respectively) in relation to CpG Islands (x-axis; bottom panel). (C,D) Unsupervised hierarchical clustering results from 5 mC (C) and 5 hmC (D) beta values with human and monkey samples depicted in red and black, respectively (top panel), and the mean beta value (y-axis) from each 5 mC (C) and 5 hmC (D) sample (x-axis) (bottom panel).

