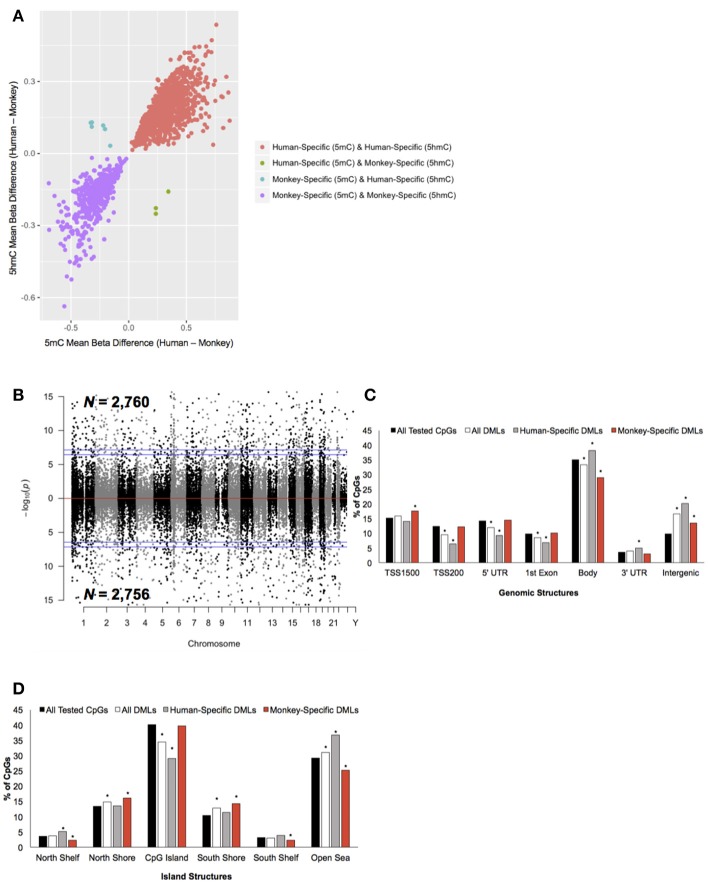
Figure 2.
Characterization of DMLs across standard genomic structures. (A) Scatterplot of CpGs found to be both differentially methylated and differentially hydroxymethylated. The difference in the mean beta values from 5 mC (x-axis) and 5 hmC (y-axis) are plotted (positive value = more 5 mC/5 hmC abundance in humans and a negative value = more 5 mC/5 hmC levels in monkeys). Loci that were human-specific (red) and monkey-specific (purple) in both the 5 mC and 5 hmC datasets are shown. Loci that were human-specific in the 5 mC and monkey-specific in the 5 hmC (green) or monkey-specific in the 5 mC and human-specific in the 5 hmC (blue) are shown. (B) Modified Manhattan plot of species-specific DMLs from brain tissue reveals DMLs to be distributed across the entire human genome. Human-specific and monkey-specific DMLs are displayed with the –log10 of the raw P-value (y-axis). Significant DMLs are displayed outside of the dashed lines (genome-wide significance of 0.05 and 0.01), and they alternate between black and gray to indicate each chromosome. (C) The percent distribution (y-axis) of all CpGs investigated (black), all DMLs (white), human-specific DMLs (gray), and monkey-specific DMLs (red) in each genomic structure are shown. Significant over- and under-representation of DMLs are indicated (*P < 0.01). (D) The percent distribution (y-axis) of all CpGs investigated (black), all DMLs (white), human-specific DMLs (gray), and monkey-specific DMLs (red) in each island structure are shown. Significant over- and under-representation of DMLs are indicated (*P < 0.01).

