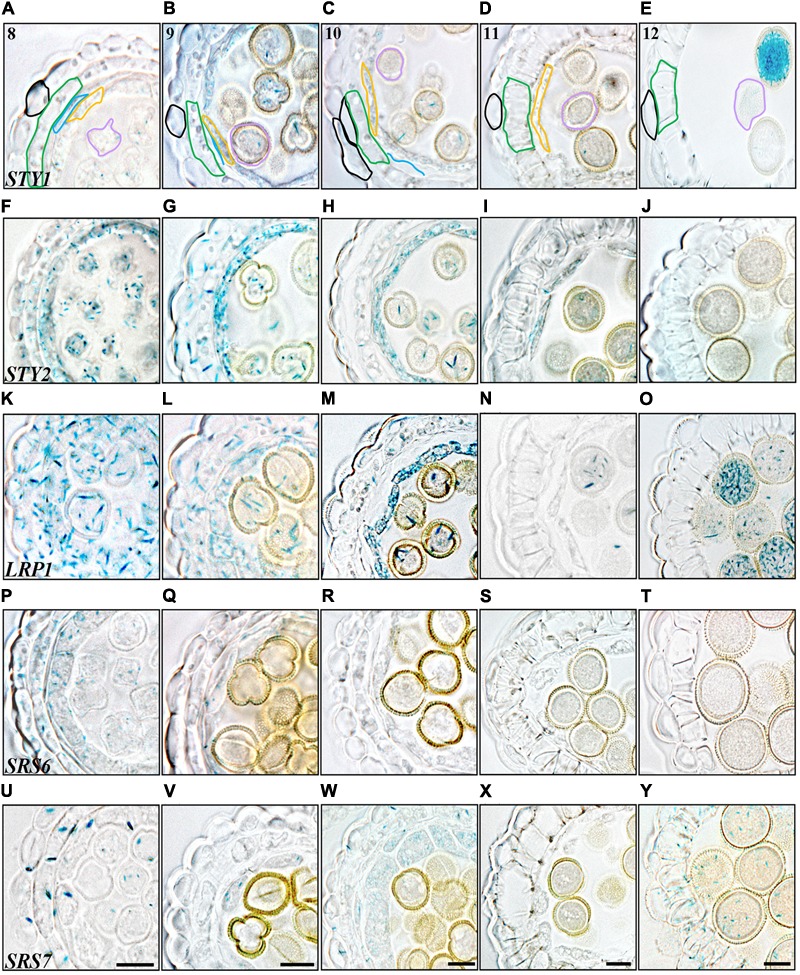
FIGURE 3.

Histochemical analyses of SHI/STY promoter activity through late stages of anther development. (A–E) STY1pro:GUS staining. (F–J) STY2pro:GUS staining. (K–O) LRP1pro:GUS staining, (P–T) SRS6pro:GUS staining. (U–Y) SRS7pro:GUS staining. (A,F,K,P,U) Stage 8, microspores released. (B,G,L,Q,V) Stage 9, microspores with exine wall. (C,H,M,R,W) Stage 10, tapetal degeneration initiated and microspores binuclear. (D,I,N,S,X) Stage 11, lignified endothecium. (E,J,O,T,Y) Stage 12, tapetum disappearance and pollen trinuclear. Promoter activity is visible as blue staining in cross-sections of microsporangia. Anther stages are indicated with numbers and individual cell-boundaries have been highlighted in STY1pro:GUS cross-sections, Black: Epidermis; Green: Endothecium; Blue: Middle layer; Orange: Tapetum; Purple: Gametophyte. Bars = 10 μm. All pictures of each stage are at the same magnification and representative bars are shown for SRS7pro:GUS.
