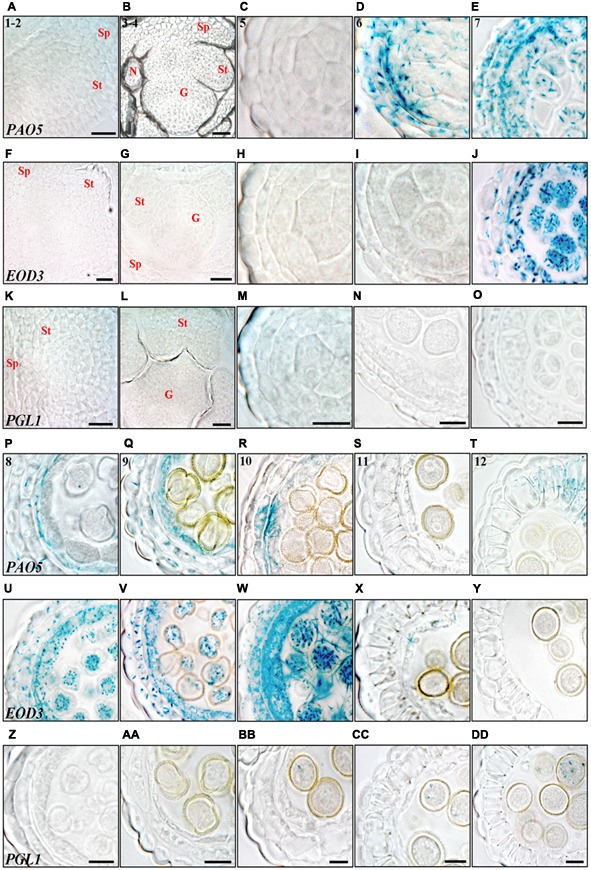
FIGURE 7.

Histochemical analysis of promoter activity of STY1 targets through anther development. (A–E,P–T) PAO5pro:GUS, (F–J,U–Y) EOD3pro:GUS and (K–O,Z–DD) PGL1pro:GUS activity visualized as blue staining in cross-sections of floral buds (stages 1–2 and 3–4) and microsporangia (stage 5–12). Numbers in PAO5pro:GUS microsporangia cross-sections indicate anther stages. (A,F,K) Stage 1–2. (B,G,L) Stage 3–4. (C,H,M) Stage 5. (D,I,N) Stage 6. (E,J,O) Stage 7. (P,U,Z) Stage 8. (Q,V,AA) Stage 9. (R,W,BB) Stage 10. (S,X,CC) Stage 11. (T,Y,DD) Stage 12. Letters indicate floral parts or their primordial equivalents, St, Stamen; G, Gynoecium; Sp, Sepal; N, Nectary. Bars at stages 1–2 and 3–4 = 20 μm. Bars at stages 5–12 = 10 μm.
