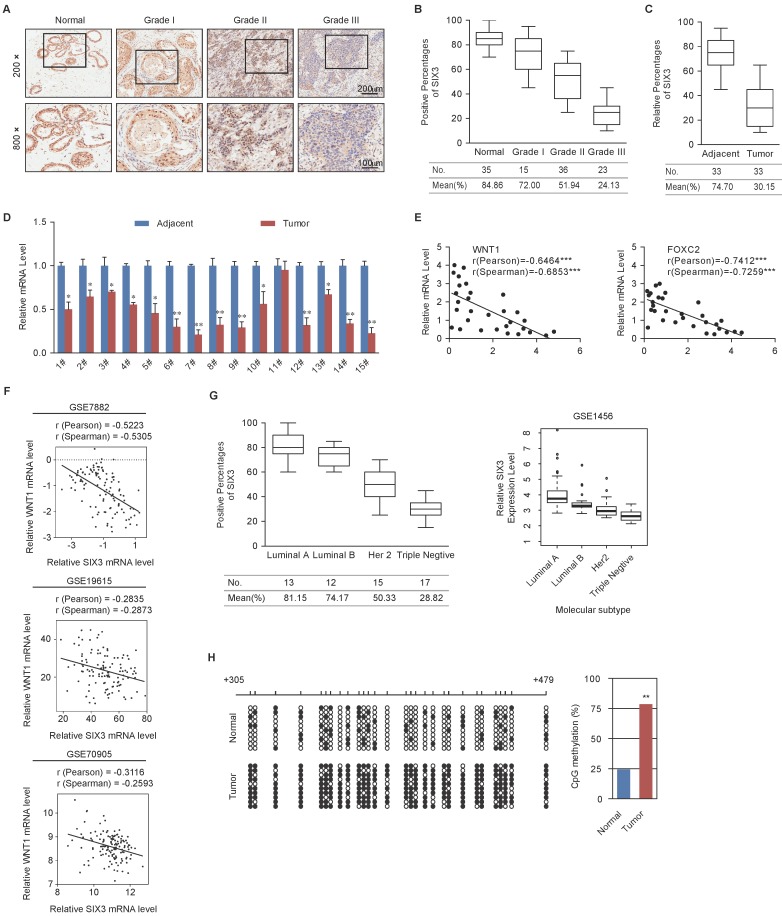
Figure 6.
Expression of SIX3 is Negatively Correlated with Breast Cancer Malignancy (A) Immunohistochemical staining of SIX3 in normal breast tissue and breast carcinomas (histological grades I, II, and III). For each grade, representative photos of two specimens are shown. (B, C) The positively stained nuclei (%) in grouped samples (B) or 30 paired samples (C) were analyzed by two-tailed t test. (D) SIX3 mRNA is downregulated in breast cancer. Total RNA in paired samples of breast cancer versus adjacent normal breast tissue were extracted and the expression of each gene was measured by qPCR. mRNA levels were normalized to those of GADPH. Each bar represents the mean ± SD for triplicate experiments (*p < 0.05; **p < 0.01; ***p < 0.001, two-tailed t test). (E) SIX3 mRNA level is negatively correlated with the level of WNT1 or FOXC2 mRNA. The relative level of SIX3 expression was plotted against the relative level of WNT1 or FOXC2 expression (***p < 0.001, two-tailed t test). (F) Analysis of public data sets (GSE7882, GSE19615, and GSE70905) for expression of SIX3 and WNT1 in breast cancer. The relative expression level of WNT1 was plotted against that of SIX3. (G) Analysis of clinical data collected for this study (left panel) or public dataset GSE1456 (right panel) for the expression of SIX3 by molecular subtype. (H) Bisulfite sequencing shows that SIX3 promoter methylation is increased at a number of CpG sites in tumor tissue compared to adjacent normal tissue. Each row represents the analysis of ten individual paired samples, and each square is a single CpG site. White and black squares represent unmethylated and methylated CpGs, respectively. *p < 0.05 and **p < 0.01 (two-tailed t test).

