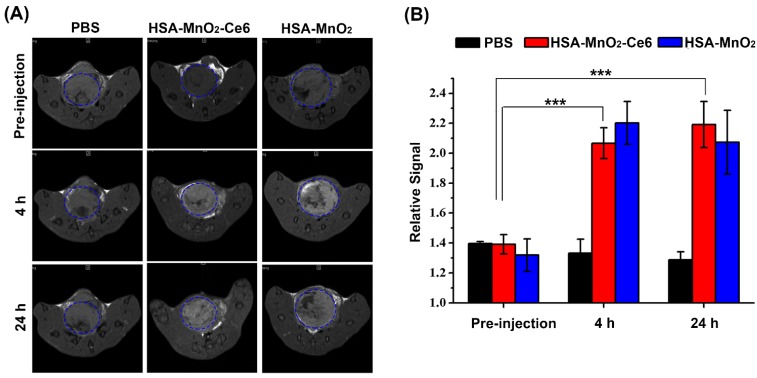
Figure 5.
(a) In vivo MR images of mice with orthotopic bladder cancer after intravenous injection of PBS or HSA-MnO2 or HSA-MnO2-Ce6 NPs at 0, 4, and 24 h. Areas in blue dotted circles represent the tumors in bladders. (b) Relative signal intensity of bladder areas at different time intervals based on MR images shown in (a). Relative signal intensity (RSI) was calculated from the ratio between signals in tumor areas and normal tissue areas (***p < 0.001). Error bars indicate standard deviations of three independent measurements.

