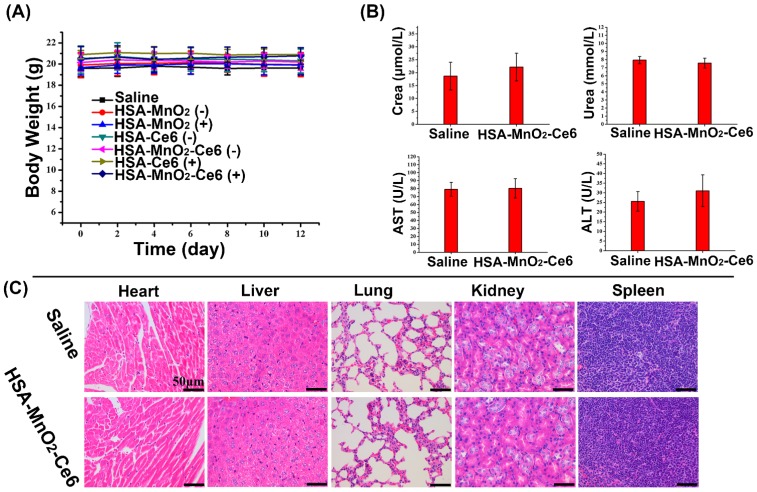
Figure 9.
(a) Body weight of mice in different groups after treatments. (b) Hepatic function evaluated by ALT and AST levels and renal function by UREA and CREA levels. (c) HE staining of the five tissues (heart, liver, spleen, lung, and kidney). Error bars indicate standard deviations of four independent measurements.

