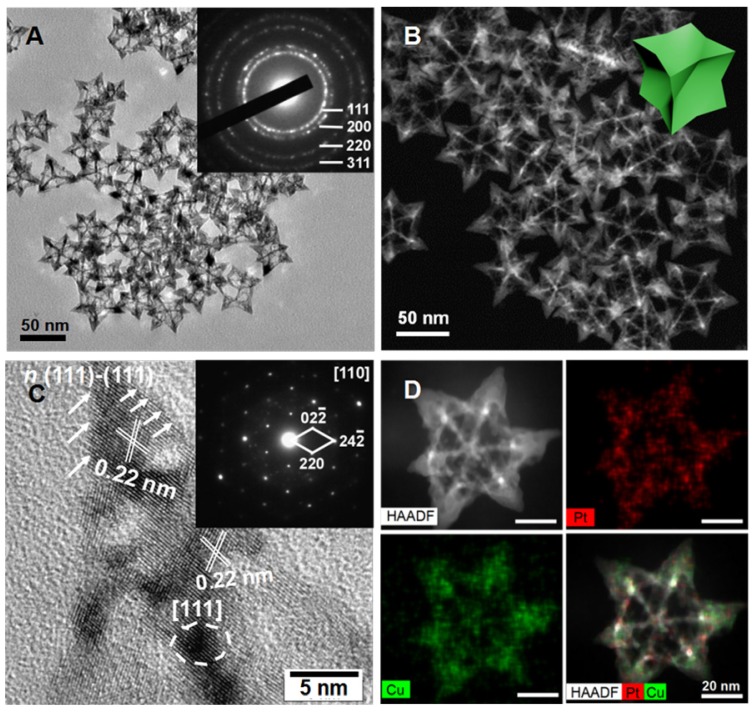
Figure 1.
(A) TEM image of the PtCu OPCNs, the inset image shows the diffraction rings of individual CONFs; (B) The HAADF-STEM image of the as-synthesized OPCNs; (C) High resolution TEM image of one foot on the OPCNs, the white arrows show the high-index facets of n (111)-(111); The inset image shows the corresponding fast Fourier transition pattern; and (D) HAADF-STEM and EDX mapping images of an individual OPCNs.

