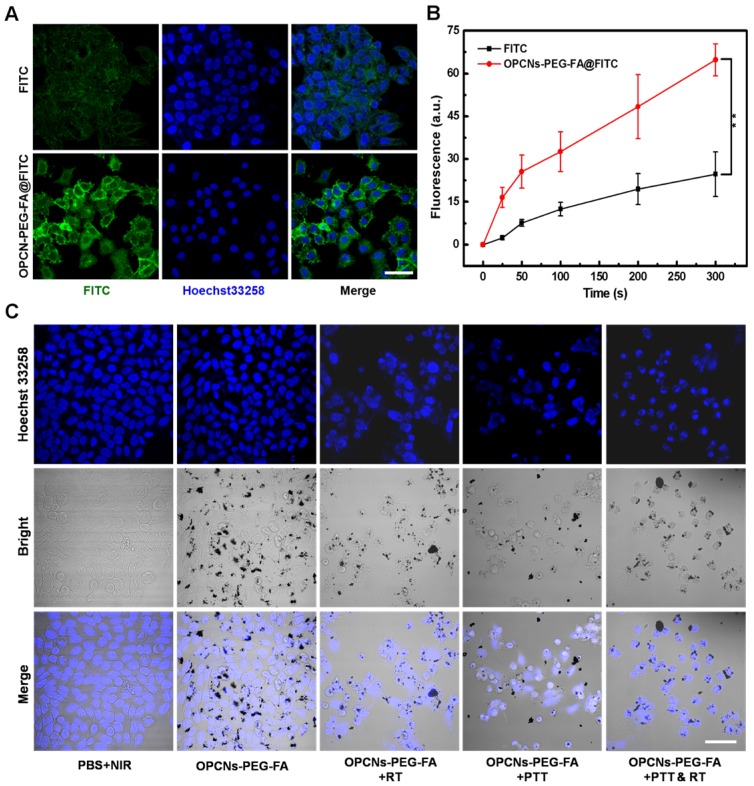
Figure 3.
(A) CLSM images of HepG2 cells incubated with FITC alone and OPCNs-PEG-FA@FITC (200 μg/mL) nanoparticles for 6 h; (B) Fluorescence signal of OPCNs-PEG-FA@FITC in HepG2 cells (n = 5); and (C) CLSM images of HepG2 cells incubated with OPCNs-PEG-FA under different conditions. Scale bar: 50 μm.

