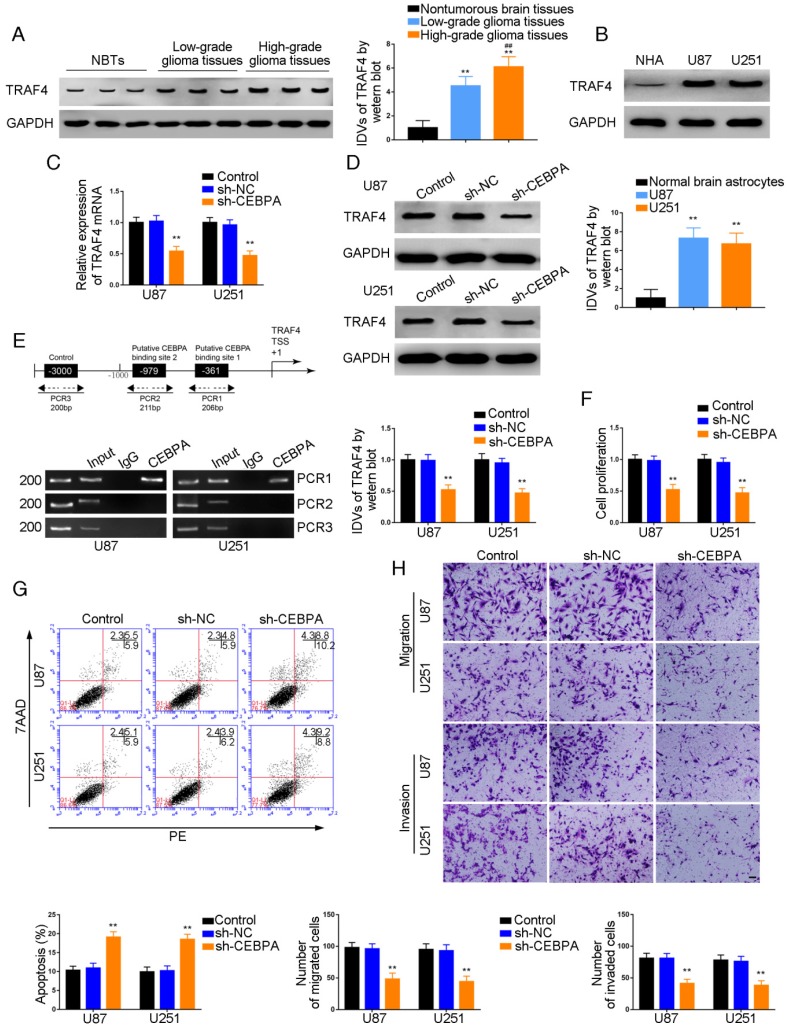
Figure 5.
Effect of CEBPA on the biological behavior of glioma cells via up-regulation of TRAF4. (A) TRAF4 protein expression levels in normal brain (NBT), low-grade, and high-grade glioma using GAPDH as an endogenous control. Representative protein expressions and their integrated density values (IDVs) of TRAF4 NBT, low-grade glioma (WHO I-II), and high-grade glioma (WHO III-IV) are shown (data are presented as the mean ± SD (n = 15, each group);**P < 0.01 relative to NBTs group; ##P < 0.01 relative to low-grade glioma group). (B) TRAF4 protein expression levels in normal human astrocytes (NHA), U87 and U251 cells and using GAPDH as an endogenous control. Representative protein expressions and their IDVs in NHA, U87 and U251 are shown (data are presented as the mean ± SD (n = 3, each group);**P < 0.01 relative to NHA group). (C, D) qRT-PCR and Western blot analysis for CEBPA-regulatedTRAF4 expression in U87 and U251 cells. The relative expression of TRAF4 is shown using GAPDH as an endogenous control. The IDVs of TRAF4 are shown using GAPDH as an endogenous control (data are presented as the mean ± SD (n =3, each group; **P < 0.01 relative to sh-NC group). (E) CEBPA bound to the promoters of TRAF4 in U87 and U251 glioma cells. Transcription start site (TSS) was designated as +1. Putative CEBPA binding sites are illustrated. Immunoprecipitated DNA was amplified by PCR. Normal rabbit IgG was used as a negative control. (F) Cell Counting Kit-8 (CCK-8) assay was used to evaluate the effect of CEBPA on U87 and U251 cells' proliferation. (G) Flow cytometry analysis of U87 and U251 cells affected by CEBPA (data are presented as the mean ± SD (n =3, each group);**P < 0.01 relative to sh-NC group). (H) Quantification of number of migrating and invading cells affected by CEBPA. Representative images and corresponding statistical plots are presented (scale bars represent 80μm).

