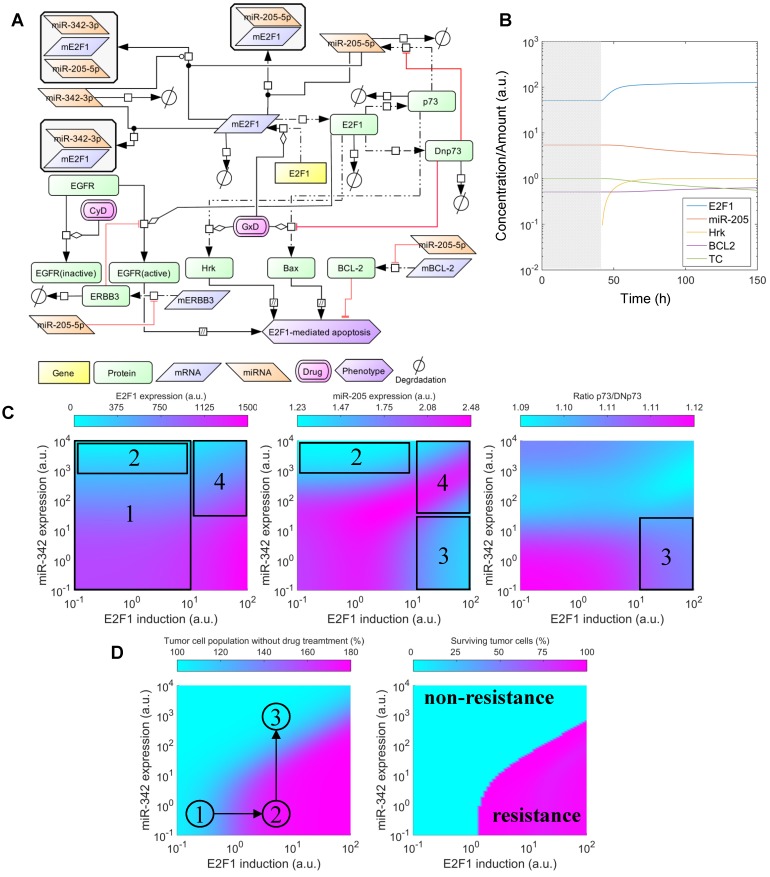
Figure 5.
Effects of cooperative E2F1 repression on chemoresistance. (A) Biochemical reaction network underlying the kinetic model of E2F1-mediated drug resistance. (B) Illustration of a typical model simulation, accounting for the temporal dynamics of E2F1 protein, miR-205-5p, Harakiri protein (Hrk), BCL2 protein and the population of tumour cells (TC) before (shaded area) and after drug administration (white area). (C) Model predicted values of E2F1, miR-205-5p and the ratio between p73 and DNp73 for different combinations of E2F1 and miR-342-3p expression levels, whose corresponding variables FSE2F1 and FSmiR342 were iteratively modified in the specified intervals. The highlighted and indexed areas correspond to the description in the main text. (D) Predicted tumour cell population size in non-genotoxic drug stimulation conditions (left) and predicted fraction of surviving tumour cells 48 h after genotoxic drug administration (right). The enclosed numbers indicate the transition of tumour growth rate under different biological conditions.

