Figure 3.
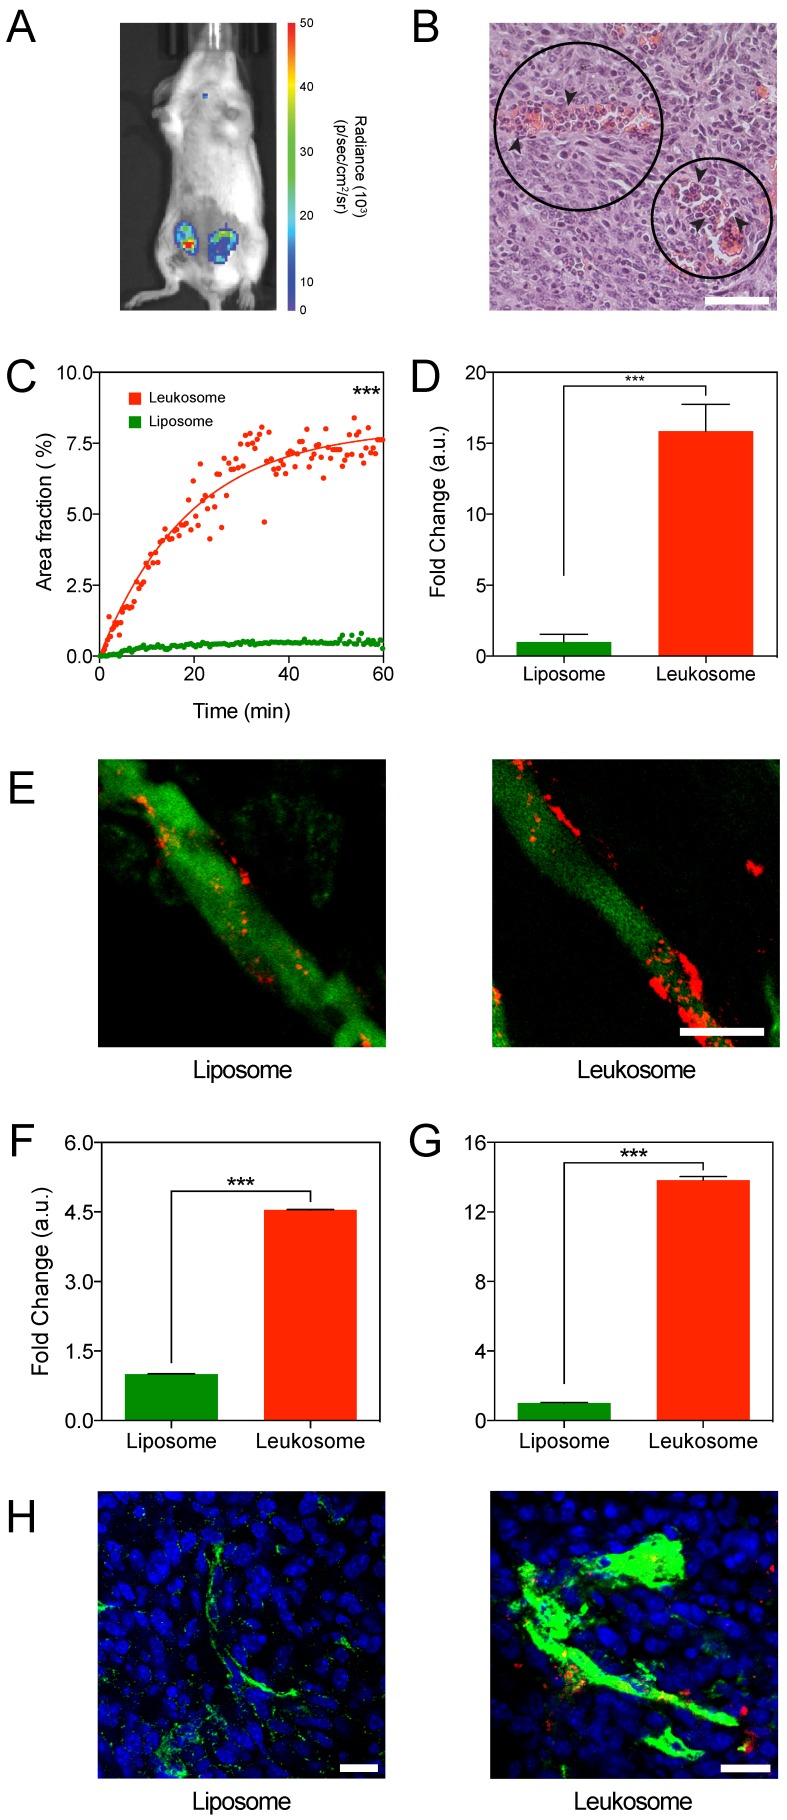
Targeting of activated tumor vasculature. A) Bioluminescence imaging of 4T1 tumors after administration with luminol to image presence of inflammation. B) H&E image (40× magnification) of a 4T1 tumor showing local necrosis with the presence of neutrophil infiltration (arrows) within the haphazard structure and distribution of blood vessels (circles); scale bar: 50 µm. C) Plot of the first 60 min of NPs accumulation in 4T1 tumors. D) Quantification of NPs in ex vivo images of tumors at 1 h after administration. E) Representative IVM images of 4T1 tumor vessels at 1 h after NP administration. NPs in red, vessels in green, scale bar: 25 µm. F,G) Quantification of NPs found within the lumen of vessels (F) and adhered to the vessel wall (G), with values normalized to vessel area. H) Representative immunofluorescence images of 4T1 tumor sections displaying the distribution of NPs (red) to CD31 (green) at 24 h after NP administration; scale bar: 50 µm. For all graphs: *** p < 0.001 and values represent the mean with error bars as s.e.m.

