Figure 5.
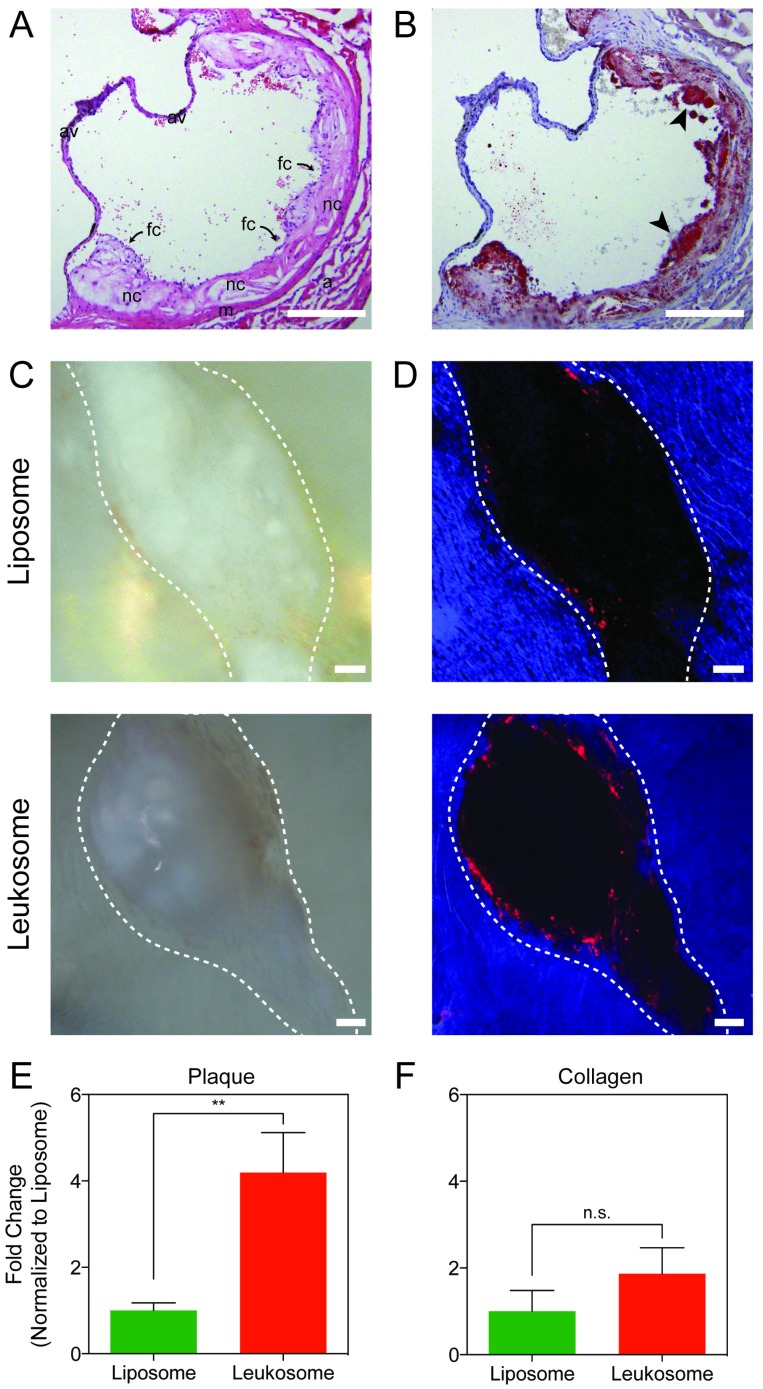
Evaluation of lesion targeting. A) H&E image of the aortic sinus displaying advanced vascular lesions: fibrous cap with inflammatory infiltrate (fc) covering necrotic core (nc). Also seen is the tunica media (m), tunica adventitia (a), cusps of aortic valve (av); scale bar: 200 µm. B) Section of the aortic sinus stained with Oil Red O showing diffuse deposition of lipid throughout the vascular lesion (in red) and foam cells (black arrows); scale bar: 200 µm. C,D) Representative bright-field (C) and fluorescence (D) images of vascular lesions (outlined in white) treated with liposomes or leukosomes. NP are in red and auto-fluorescence of collagen in blue, scale bar: 100 µm. E,F) Quantification of NP accumulation in lesion (E) or collagen (F). For all graphs: ** p < 0.01 and values represent the mean with error bars as s.e.m.

