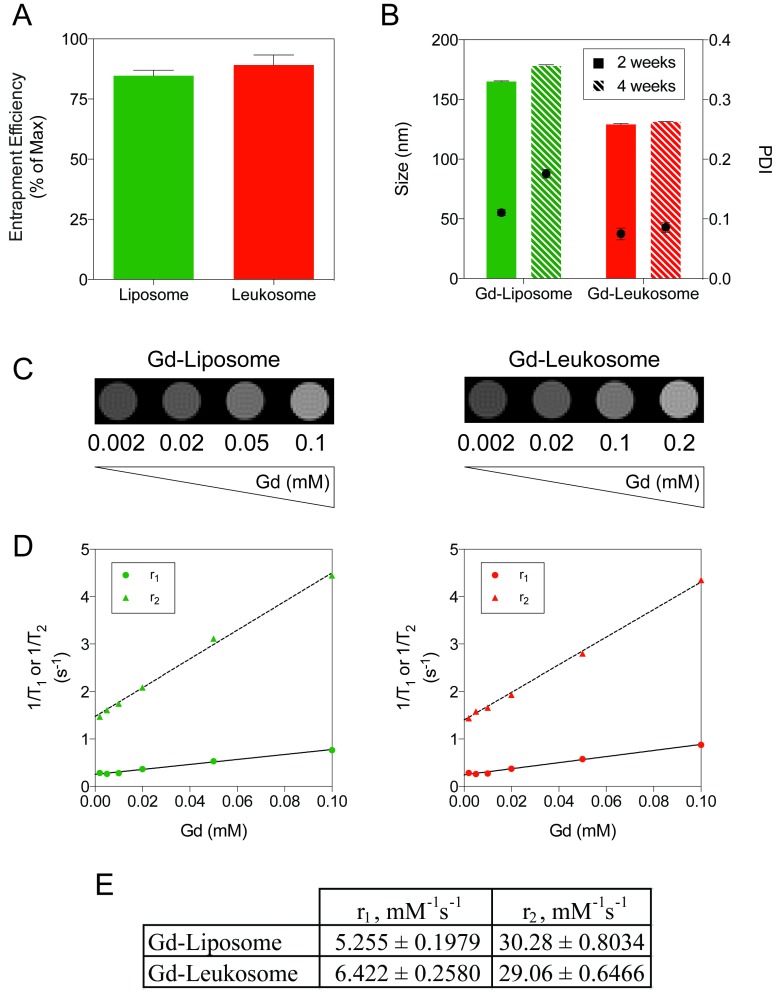
Figure 6.
Gd incorporation into NPs for MRI applications. A) Quantification of Gd entrapment within liposomes and leukosomes. B) Comparing the size (left axis and bars) and PDI (right axis and dots) stability of Gd-labeled liposomes and leukosomes after 2 and 4 weeks. C) T1WI images of phantoms containing different amounts of Gd-liposomes or Gd-leukosomes, ranging from 2-100 μM of Gd. D) Relaxometric titrations (r1 and r2) of phantoms containing different amounts of Gd-liposomes or Gd-leukosomes. E) The relaxivities, r1 and r2 values, were obtained from the linear fittings of the corresponding experimental data (as of the slopes, in unit of mM-1 s-1). For all graphs: values represent the mean with error bars as s.e.m.

