Figure 3.

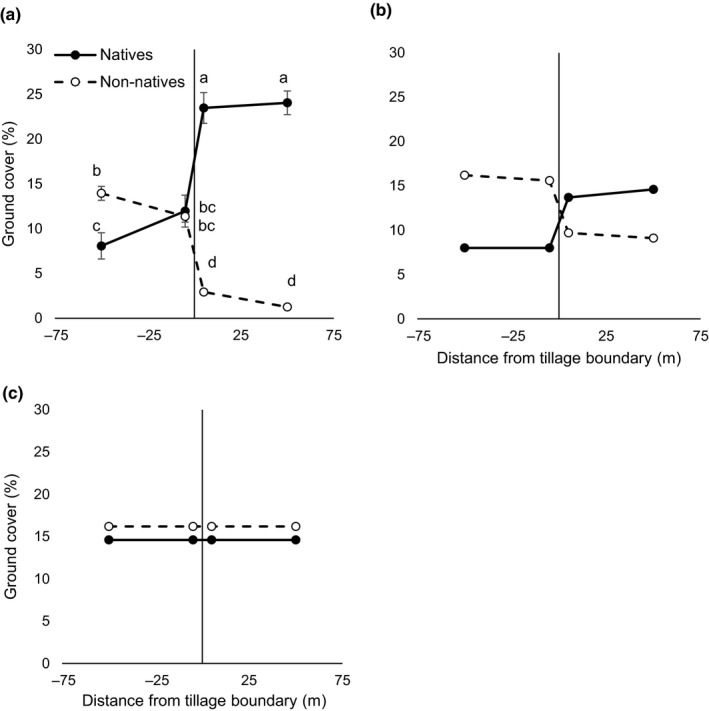
(a) Observed and (b and c) predicted abundance of three dominant native and three dominant non‐native plants (% ground cover) across historical tillage boundaries. Observed data represent the mean cover of the target species in 25 paired, randomly selected fields near Winthrop, WA, USA. (b) Consistent with observed plant growth, a plant growth model that included plant–soil feedback effects predicted that native plants would dominate on native soils and non‐native plants would dominate on non‐native soils. This model assumed that propagule pressure was equal for all species on all soils. (c) When PSF effects were removed from the model, non‐native plants were predicted to dominate the landscape. See Section 2 for model description. Negative x‐axis values indicate samples taken within abandoned‐agricultural fields and positive values indicate samples taken in adjacent undisturbed soils (Kulmatiski, unpublished). Values of plant cover represent the mean for 25 fields (±1 SE). Native and non‐native values within a distance category with an asterisk are different at the α = .05 level
