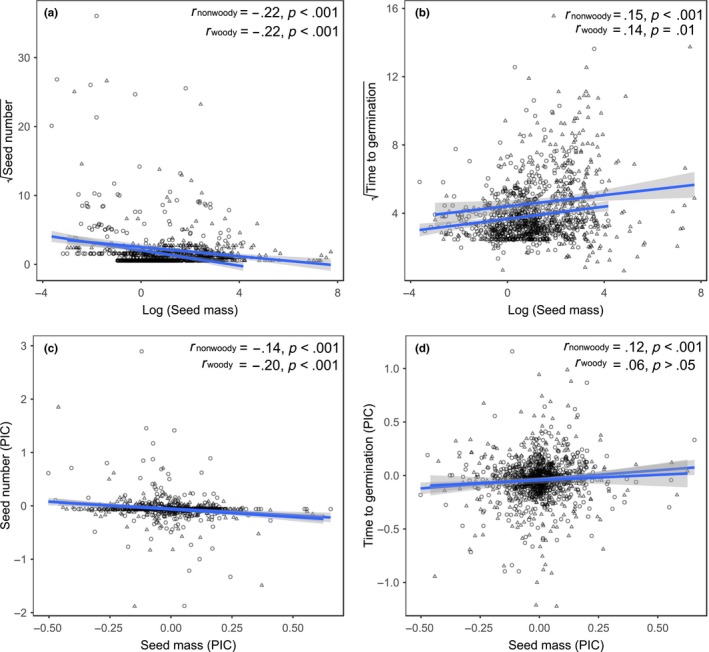
Figure 4.

Ordinary Pearson correlations between seed mass and seed number (a) as well as between seed mass and time to germination (b) for 726 nonwoody (circles) and 393 woody species (triangles) from the Mountains of Southwest China. (c) and (d) represent ordinary Pearson correlations with phylogenetically independent contrasts for the same response variables and sources of variation. The gray areas represent 95% confidence intervals of models
