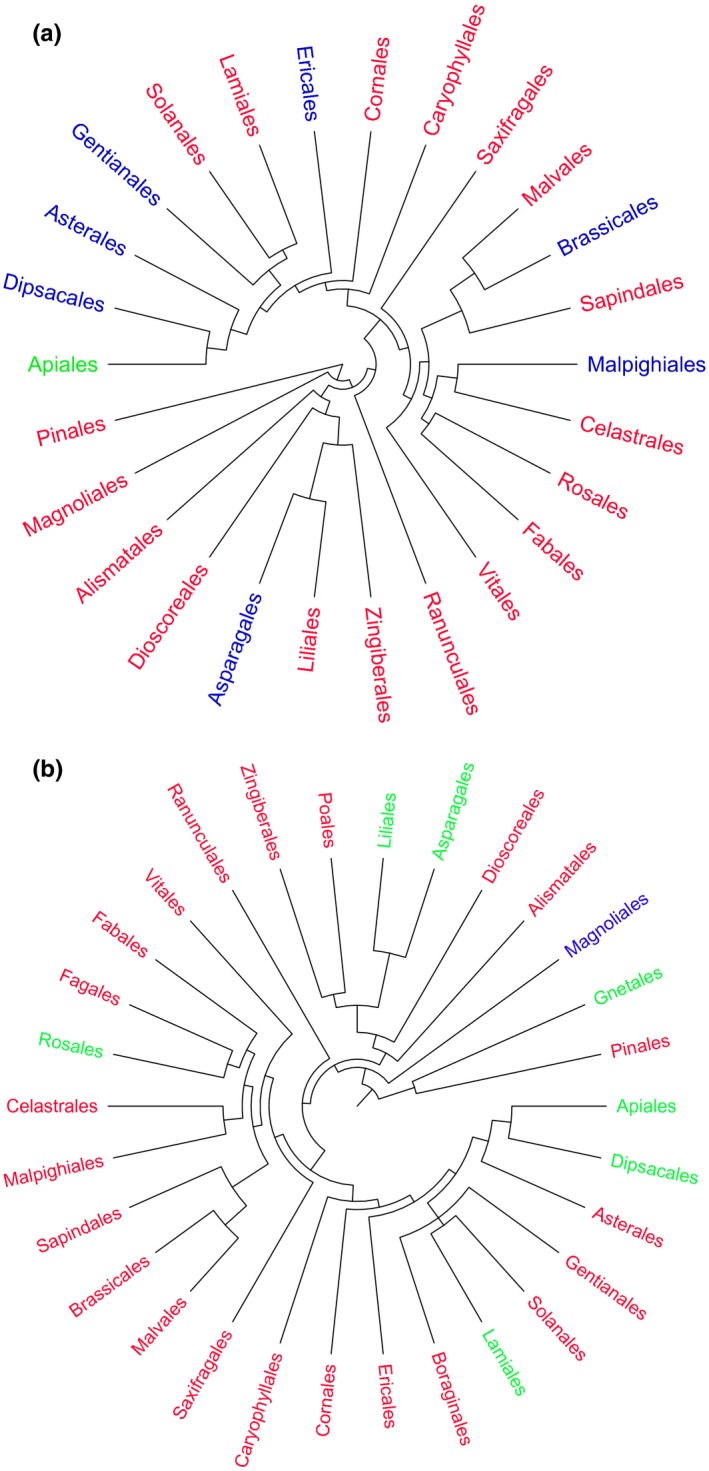
Figure 5.

Phylogenetic tree based on APGIII at the order level for 1,119 samples collected from our study site in the Mountains of Southwest China. Tree depicts the phylogenetic dispersion of the relation between (a) seed mass and seed number as well as (b) seed mass and time to germination. The taxa highlighted in blue indicate the presence of a significant negative relation, while the taxa highlighted in green indicate the occurrence of a significant positive relation. The taxa highlighted in red did not show a significant relation among seed traits
