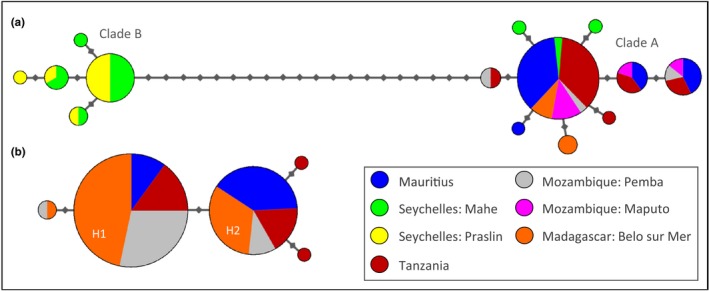
Figure 2.

Haplotype network of (a) Lethrinus mahsena and (b) Lethrinus harak based on 486 bp of COI mtDNA. Each small gray diamond represents a single mutation; branch lengths are proportional to the number of differences, and node size is proportional to the haplotype frequency
