
Figure 5.
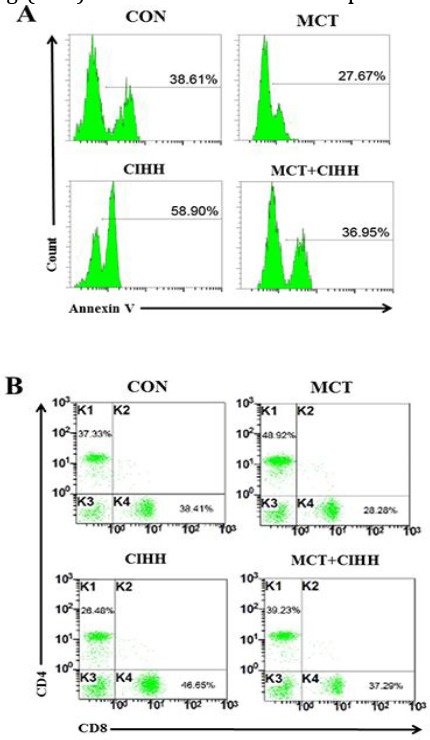
Effect of CIHH on T lymphocytes apoptosis and differential frequencies of lymphocyte subclasses in MCT-treated rats. Representative flow chart of spleen apoptotic CD3+T lymphocytes in rats of each group (A). Representative flow chart of CD4+ and CD8+T lymphocyte levels in peripheral blood of rats in each group (B)