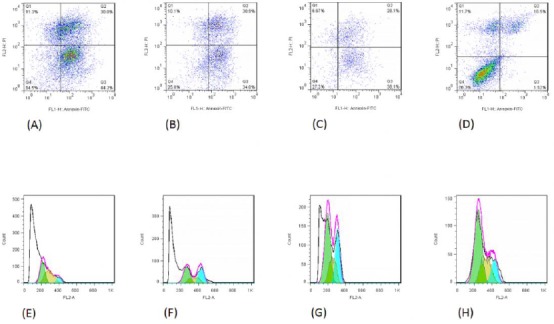
Figure 1.

The death of AGS cells treated with cucurbitacins D (panel A), E (panel B), I (panel C), and untreated control cells (panel D). Panels A-D: Top left corner shows the necrotic cells, top right corner shows late apoptotic cells, bottom left corner shows healthy live cells, and bottom right corner shows early apoptotic cells. Panels E-H: Sub-G1 accumulation of AGS cells treated with cucurbitacins D (panel E), E (panel F), and I (panel G), in comparison to the untreated control cells (panel H)
