Figure 3.

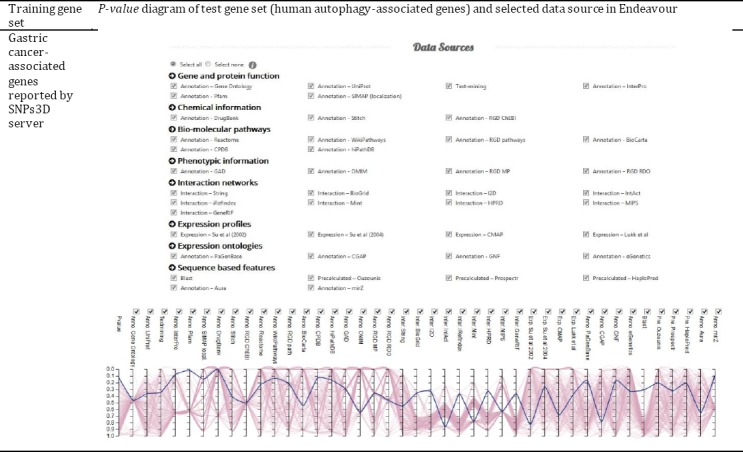
Endeavour prioritization diagram of autophagy genes in relation to gastric cancer. The bold line in the diagram corresponds to LC3 gene’s P-value. The other lines belong to other autophagy-associated genes.

Endeavour prioritization diagram of autophagy genes in relation to gastric cancer. The bold line in the diagram corresponds to LC3 gene’s P-value. The other lines belong to other autophagy-associated genes.