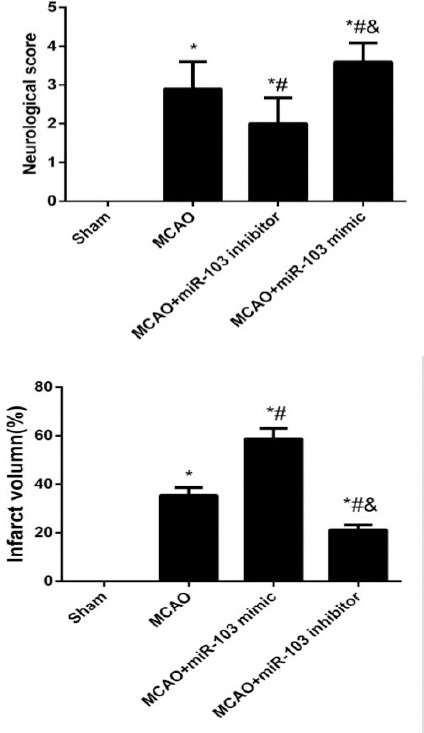
Figure 2.

Comparison of the neurological scores and infarct volume of rats after middle cerebral artery occlusion (MCAO) in different groups. *P<0.05 compared with Sham group; #, P<0.05 compared with MCAO group; &, P<0.05 compared with MCAO+miR-103 mimic group
