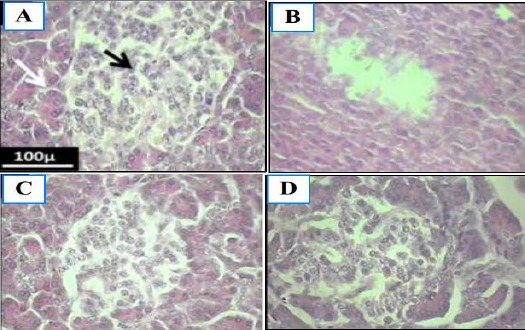
Figure 1.

The photomicrograph of pancreatic tissue in diabetic rats. A and B, the normal control and diabetic control groups respectively. C and D, the test groups which were fed with 150 and 300 mg/kg of algae hydroalcoholic extracts respectively. Black arrows, the exocrine sinuses; White arrows, the Langerhans islets (H & E Staining; 400 ×)
