
Fig. 2.
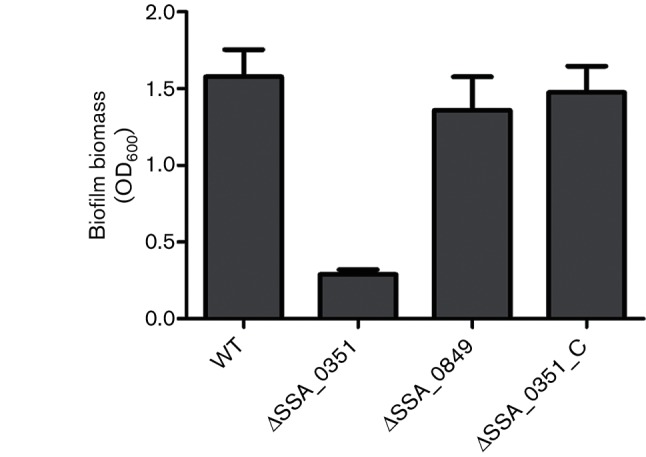
SPase-related mutants show different patterns of biofilm formation. Bacterial samples of eight replicates each were cultured anaerobically for 24 h in BM with 1 % sucrose. After crystal violet staining, biofilm formation was quantified at OD600 and the results were compared using ANOVA and the multiple comparison method (Dunnett's test). ** indicates significance with P-value <0.01.