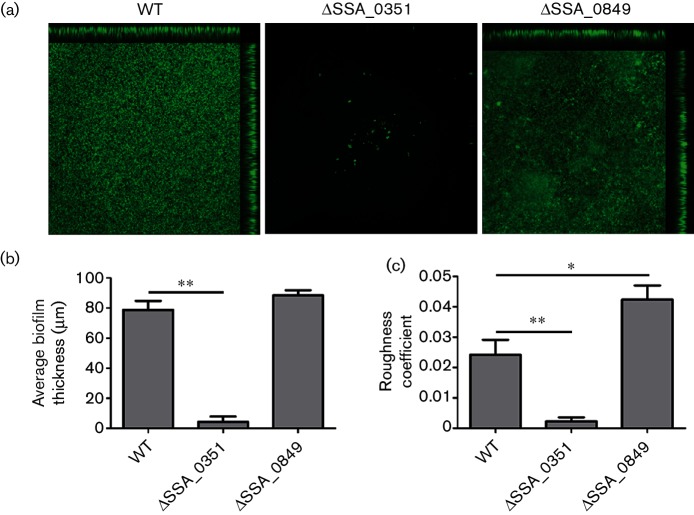
Fig. 3.
SPase-related mutants form different biofilm biomasses. Biofilm formation comparison of the SPase mutants and SK36 by confocal laser scanning microscopy (CLSM). CLSM imaging was conducted in triplicate and the images were analysed with Image J. (a) Representative images from wild-type and two SPase-related mutants, ΔSSA_0351 and ΔSSA_0849 are shown. (b) Biofilm thickness and (c) roughness coefficient parameters were measured using MATLAB. * indicates significance with P-value <0.05. **indicates significance with P-value <0.01.

