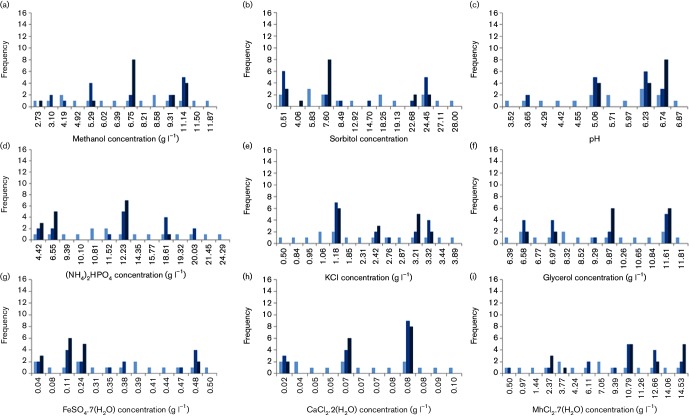
Fig. 2.
Population profiling for monitoring the absolute frequency of the levels of each factor tested in the population over generations. Absolute frequency denotes the number of times that level has been assigned to the ‘individuals’ in each ‘generation’. The factors represented here are: methanol (a), sorbitol (b), pH (c), (NH4)2PO4 (d), KCl (e), glycerol (f), FeSO4 . 7H2O (g), CaCl2 . 2H2O (h) and MgSO4 . 7H2O (i). The levels that appeared at least once in the search are displayed along the abscissa, and the absolute frequency is displayed along the ordinate. In each plot, the tone of the blue bars becomes darker for further ‘generations’ with the lightest shade representing the first ‘generation’ and the darkest tone representing the third, and last, ‘generation’ of the evolution experiments.

