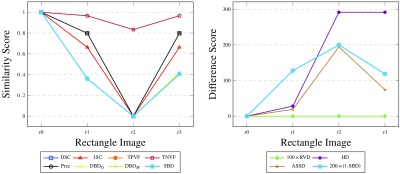
Fig. 7.

Results for synthetic rectangle images, comparing the segmented images against the ground truth, with all the considered metrics. Note that DSC, TPVF, and Prec scores are identical for all four images and their plots are not easily traced (similarity graph on the left). Likewise, and plots are almost identical with SBD.
