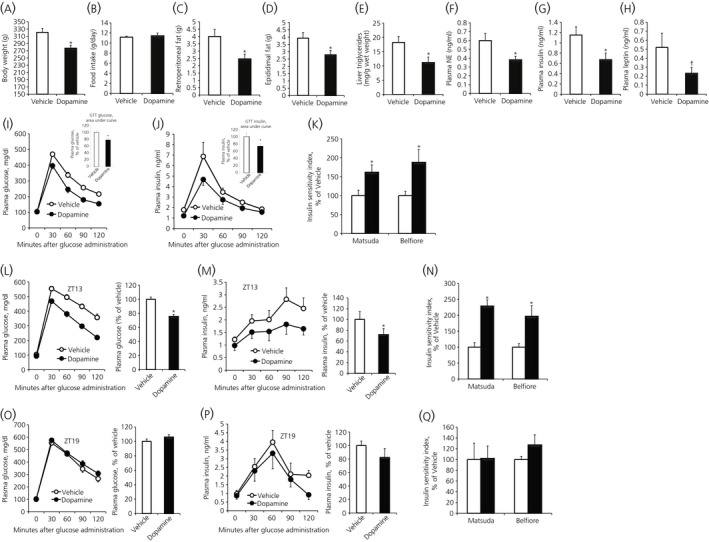
Figure 5.

Restoring the circadian dopamine peak (Zeitgeber time [ZT]13) at the peri‐suprachiasmatic nuclei (SCN) of high‐fat diet (HFD) fed, obese insulin‐resistant spontaneously hypertensive rats (SHR) rats improves dysmetabolism without affecting food consumption, whereas the same treatment outside this circadian peak window (ZT19) has no effect on insulin resistance of SHR rats. After 6 weeks on HFD, obese animals were treated daily with either vehicle (cerebrospinal fluid) or dopamine (2 nmol) infused at the peri‐SCN for 1 min unilaterally at 13 h after light onset (ZT13) for 2 weeks when maintained on the HFD. The following metabolic parameters were assessed after 2 weeks of treatment: (A) body weight at the end of treatment; (B) daily food consumption during the treatment (no difference); (C) retroperitoneal fat pad weight; (D) epididimal fat pad weight; (E) liver triglyceride level; (F) plasma norepinephrine; (G) plasma insulin; and (H) plasma leptin († P < .05, 1‐tailed t test. (I) Glucose tolerance test (GTT) plasma glucose curves (line graph) and the area under the glucose GTT curve (bar graph). (J) GTT plasma insulin curves (line graph) and the area under the insulin GTT curve (bar graph) and (K) Matsuda and Belfiore insulin sensitivity indices of SHR rats on HFD treated with either vehicle or dopamine at ZT13. Data are expressed as the mean ± SEM (n = 9 per group) (*P < .05 compared to vehicle treatment, unpaired Student's t test). (L‐Q) Comparison of metabolic response to peri‐SCN dopamine administration at ZT13 vs ZT19. GTT from rats fed HFD for 6 weeks and then receiving dopamine (2 nmol) or vehicle at the onset of locomotor activity (ZT13) or at ZT19 for 2 additional weeks when held on HFD feeding. (L) GTT plasma glucose curves (line graph) and the area under the glucose GTT curve (bar graph), (M) GTT plasma insulin curves (line graph) and the area under the insulin GTT curve (bar graph) and (N) Matsuda and Belfiore insulin sensitivity indices of vehicle (white bar) or dopamine (black bar) peri‐SCN treated animals at ZT13. (O) GTT plasma glucose curves (line graph) and the area under the glucose GTT curve (bar graph), (P) GTT plasma insulin curves (line graph) and the area under the insulin GTT curve (bar graph) and (Q) Matsuda and Belfiore insulin sensitivity indices of SHR rats on HFD treated with either vehicle (white bar) or dopamine (black bar) at ZT19. Data are expressed as the mean ± SEM (n = 6 per group) (*P < .05, unpaired Student's t test)
