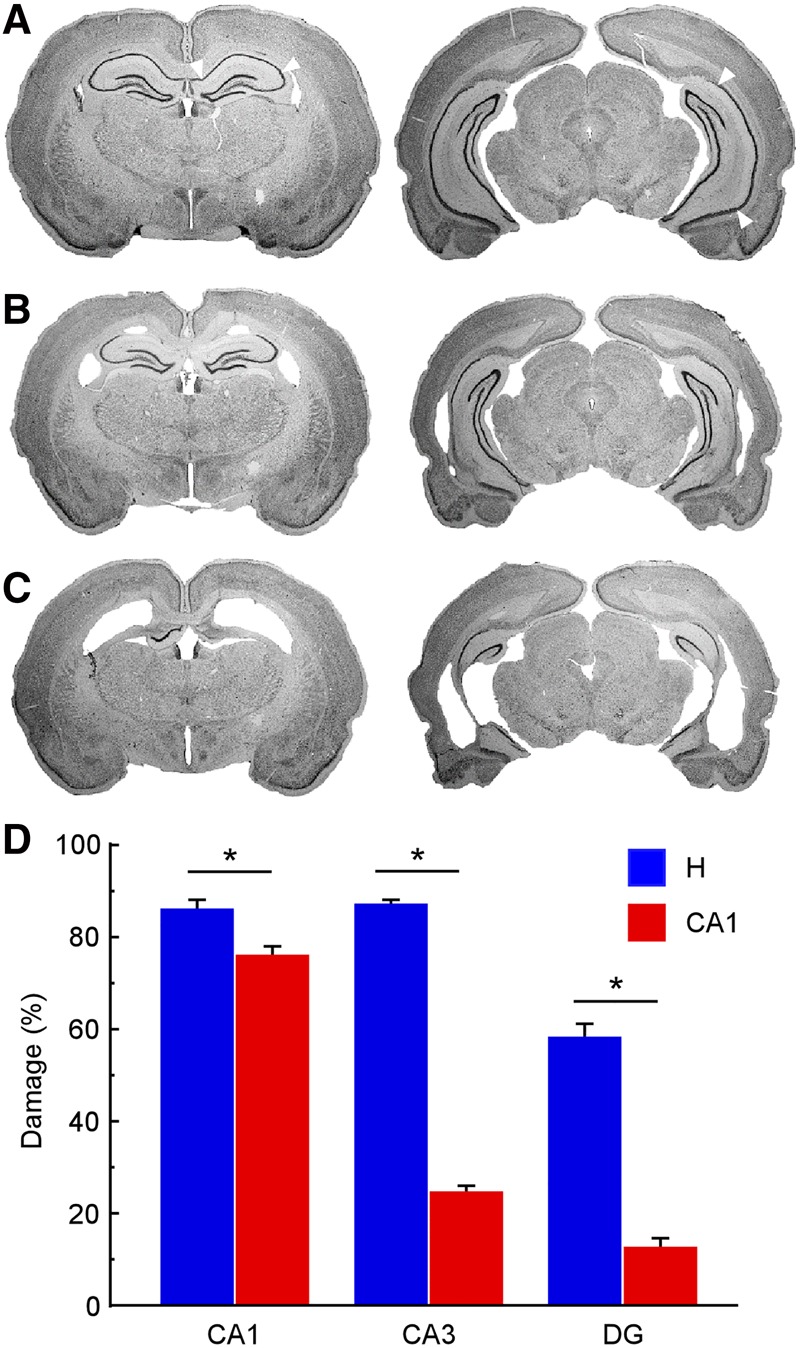
Figure 2.

CA1 lesions were selective to area CA1, while hippocampal lesions encompassed the majority of the hippocampus. Both lesions included the entire dorsoventral extent of the hippocampus. Photomicrographs at two coronal levels of a representative (A) sham brain, (B) a brain with a CA1 lesion, and (C) a brain with a hippocampal lesion. (Left to right) The sections are −2.80 and −5.40 mm posterior to bregma. White arrows indicate the CA1 borders in each section for the sham animal. (D) Mean percent damage to area CA1, area CA3, and the DG for animals with CA1 lesions (n = 24) and hippocampal lesions (n = 24). (*) denotes significant group difference, P < 0.005. Error bars indicate SEM.
