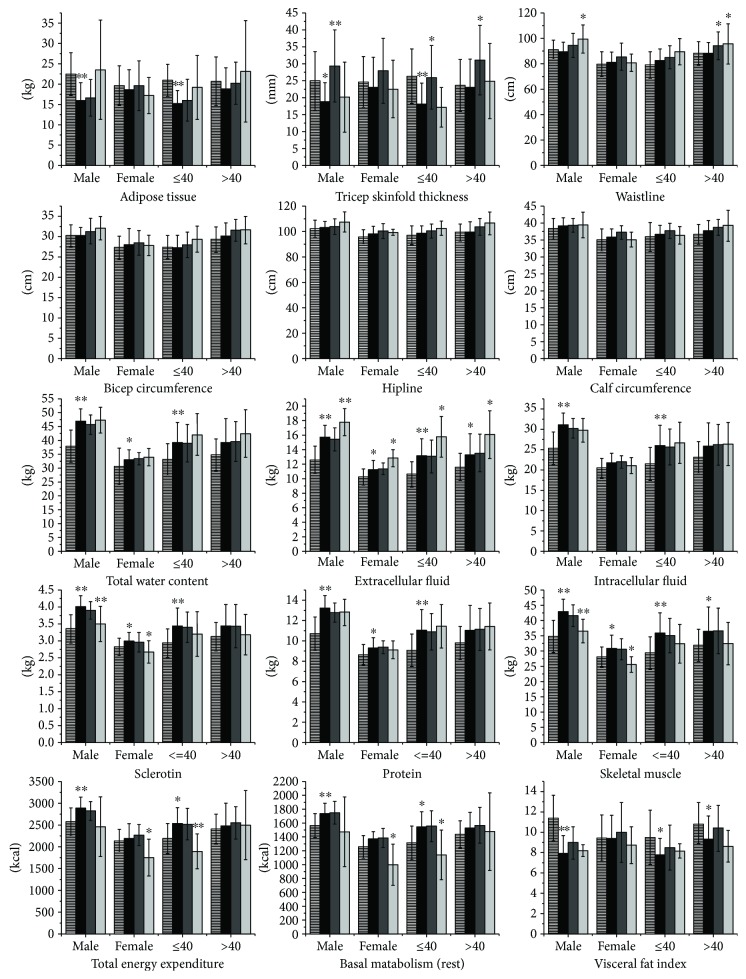
Figure 1.
Preoperative characteristics and postoperative changes in body composition and metabolism in patients with acromegaly. This figure includes 15 indices of body composition and metabolism in acromegaly patients and the controls. The bars with transverse lines represent the values of the controls. The black bars represent indices of the patients with untreated acromegaly. Dark gray and light gray bars represent indices of the patients with acromegaly at 3 months after surgery and 1 year after surgery, respectively. The ∗ above the black bars represents the preoperative comparison of results between the acromegaly patients and the controls. The ∗ above the dark gray and light gray bars represents the comparison of results between indices of the acromegaly patients during the postoperative and preoperative periods. ∗p < 0.05; ∗∗p < 0.01.

