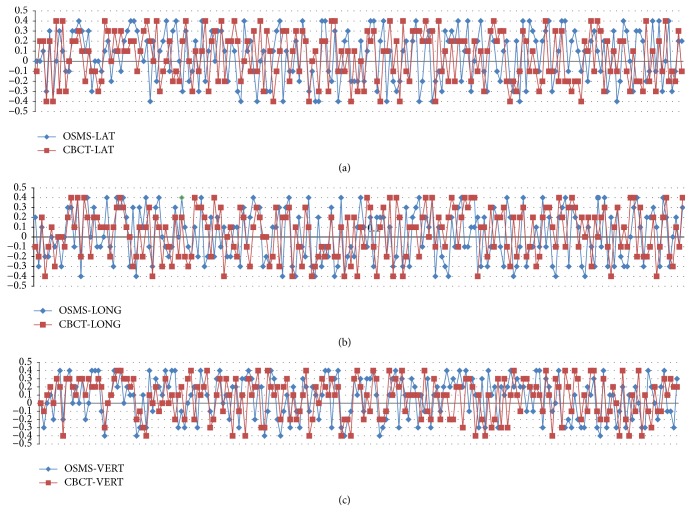
Figure 6.
(a) Interfractional displacement (cm) of 200 setups in 20 breast cancer patients in the LAT direction using the OSMS and CBCT scan. The horizontal axis represents the 200 sets of data from the 20 breast cancer patients on the LAT direction, and the vertical axis represents the interfractional displacement between the OSMS and CBCT scan. The blue line shows the displacement of the OSMS scan; the red line indicates the displacement of the CBCT scan. (b) Interfractional displacement (cm) of 200 setups in 20 breast cancer patients in the LONG direction using OSMS and CBCT scan. The horizontal axis represents the 200 sets of data from the 20 breast cancer patients on the LONG direction, and the vertical axis represents the interfractional displacement between the OSMS and CBCT scan. The blue line shows the displacement of the OSMS scan; the red line indicates the displacement of the CBCT scan. (c) Interfractional displacement (cm) of 200 setups in 20 breast cancer patients in the VERT direction using OSMS and CBCT scan. The horizontal axis represents the 200 sets of data from the 20 breast cancer patients on the VERT direction, and the vertical axis represents the interfractional displacement between the OSMS and CBCT scan. The blue line indicates the displacement of the OSMS scan; the red line shows the displacement of the CBCT scan.

