
Figure 2.
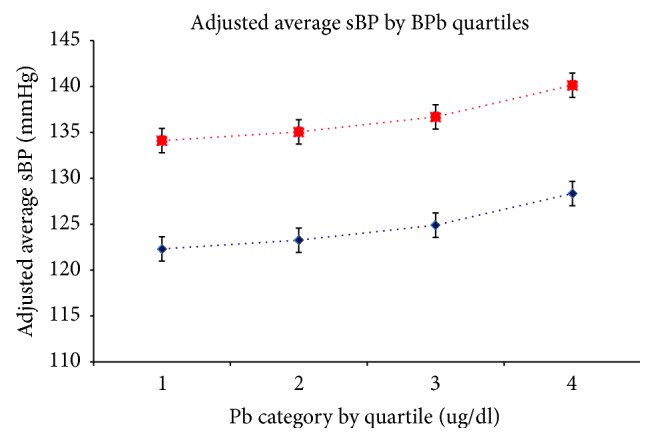
Linear relationship of concurrent BPb Quartiles and sBP for a smoker with high BMI (top) and a nonsmoker with low BMI (bottom). Adjusted for smoking, BMI, sex, ethnicity, and education.
Official websites use .gov
A
.gov website belongs to an official
government organization in the United States.
Secure .gov websites use HTTPS
A lock (
) or https:// means you've safely
connected to the .gov website. Share sensitive
information only on official, secure websites.
Linear relationship of concurrent BPb Quartiles and sBP for a smoker with high BMI (top) and a nonsmoker with low BMI (bottom). Adjusted for smoking, BMI, sex, ethnicity, and education.