
Figure2.
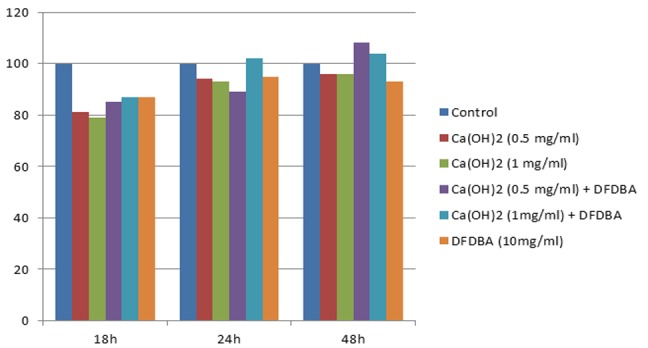
percentage change of proliferation and viability in different groups as compared with the control in different time points. DFDBA per se, Ca(OH)2 solution per se, and in combination with DFDBA
Official websites use .gov
A
.gov website belongs to an official
government organization in the United States.
Secure .gov websites use HTTPS
A lock (
) or https:// means you've safely
connected to the .gov website. Share sensitive
information only on official, secure websites.
percentage change of proliferation and viability in different groups as compared with the control in different time points. DFDBA per se, Ca(OH)2 solution per se, and in combination with DFDBA