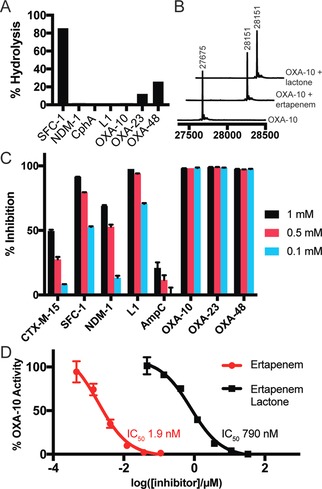
Figure 3.

A) Extent of hydrolysis of the ertapenem lactone by a panel of carbapenemases (1 h, 0.5 mm lactone, 5 μm enzyme). B) Mass spectra showing acylation of OXA‐10 (1 μm) by ertapenem (100 μm) and ertapenem lactone (100 μm) after 30 min. C) Inhibitory activity of ertapenem lactone (1 mm, 0.5 mm, 0.1 mm) against a panel of SBLs and MBLs. D) Comparison of the inhibitory activity of ertapenem and ertapenem lactone against OXA‐10.
