
Figure 1.
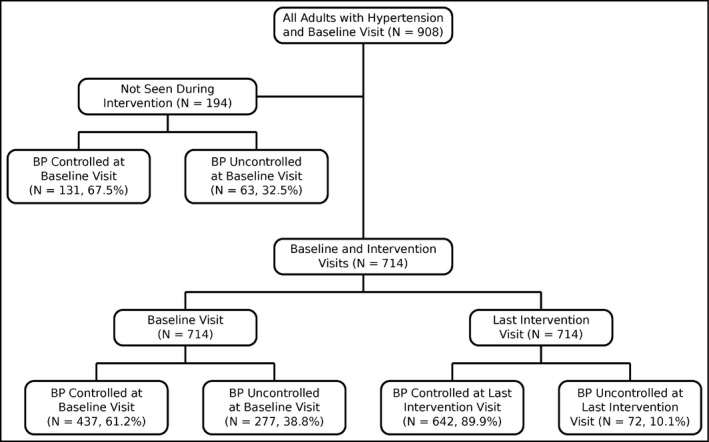
Flow diagram depicting the number of patients with hypertension and blood pressure (BP) control among those with only a baseline visit (n = 194) or both baseline and intervention visits (n = 714)
Official websites use .gov
A
.gov website belongs to an official
government organization in the United States.
Secure .gov websites use HTTPS
A lock (
) or https:// means you've safely
connected to the .gov website. Share sensitive
information only on official, secure websites.
Flow diagram depicting the number of patients with hypertension and blood pressure (BP) control among those with only a baseline visit (n = 194) or both baseline and intervention visits (n = 714)