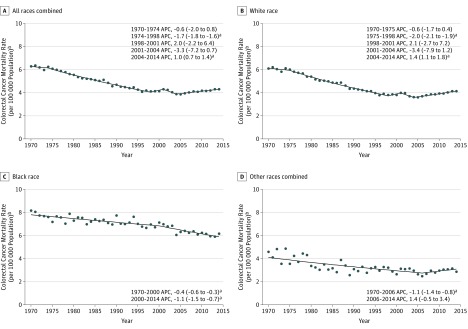
Figure. Annual Percent Change (APC) in Colorectal Cancer Mortality Rates Among Adults Aged 20 to 54 Years in the United States by Race, 1970-2014.
Lines were fitted according to the Joinpoint Regression Program (National Cancer Institute), version 4.4.0.0, which uses permutation analysis to fit a series of straight lines on a logarithmic scale to observed rates, indicated by circles; up to 4 joinpoints (5 line segments) were allowed.
aThe APC is statistically significantly different from 0 (2-sided P < .05), based on the permutation method.
bAge-adjusted to the 2000 US standard population.

