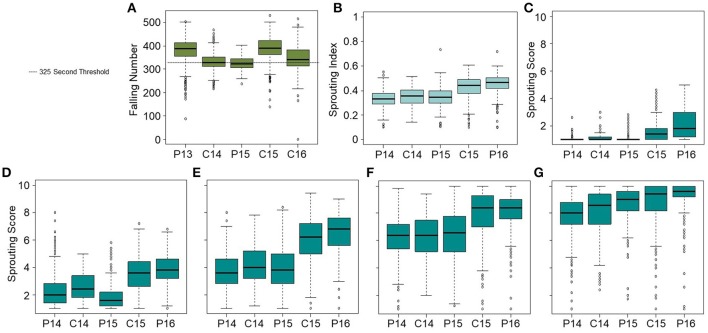
Figure 1.
FN and PHS distributions. (A) FN distributions across environments including the natural rain events in Pullman 2013 (P13) and Central Ferry 2016 (C16), an artificial rain event in Central Ferry 2014 (C14) and 2015 (C15), and an environment without rain in Pullman 2015 (P15). Spike-wetting tests were performed for Pullman 2014 (P14) as well as C14, P15, C15, and Pullman 2016 (P16). (B) Sprouting index was calculated over all 7 days of misting. Sprouting scores after (C) 3, (D) 4, (E) 5, (F) 6, and (G) 7 days of misting were based on a 1-10 scale.

