Figure 2.

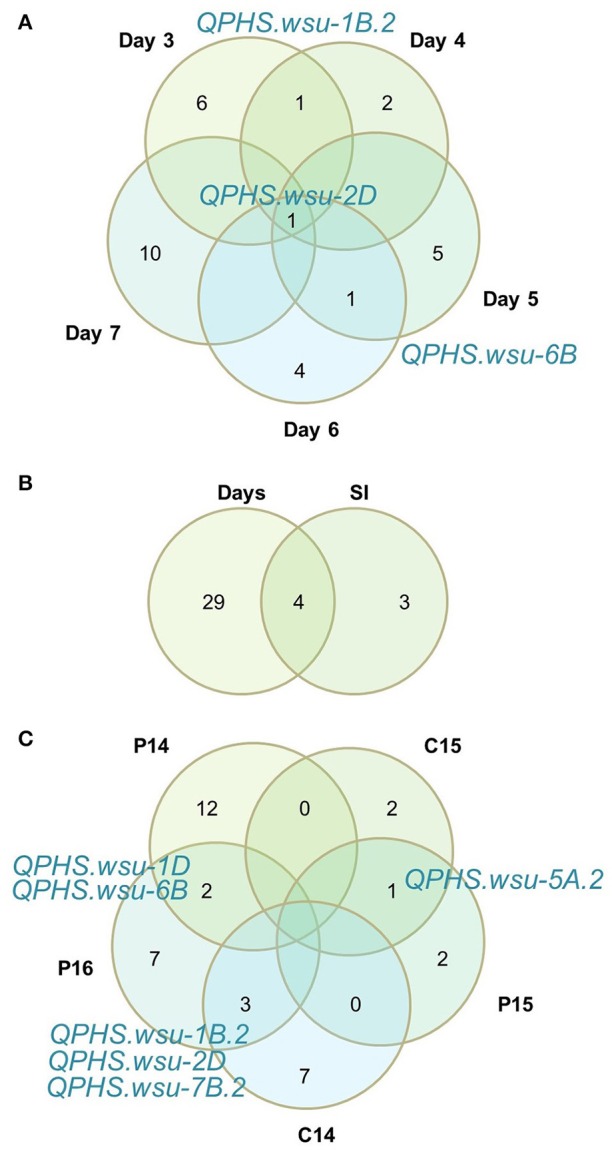
Venn diagrams comparing sprouting score QTN across (A) days misted, (B) all days misted and sprouting index, and (C) the five environments. Shared QTN are printed in blue.

Venn diagrams comparing sprouting score QTN across (A) days misted, (B) all days misted and sprouting index, and (C) the five environments. Shared QTN are printed in blue.