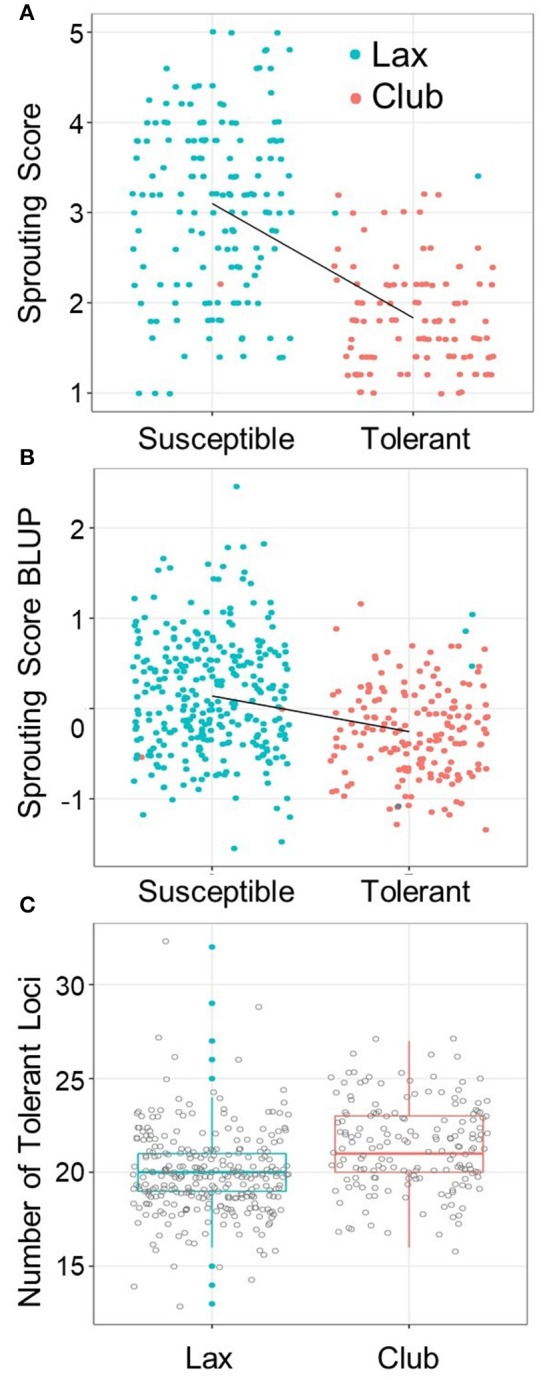
Figure 3.

QPHS.wsu-2D in club versus lax mapping lines. Scatter plot of sprouting score (A) raw means over the environment, Central Ferry 2014, that QPHS.wsu-2D had the strongest effect and (B) Sprouting score BLUPs across all five environments after 4 days of misting versus the presence of the QPHS.wsu-2D susceptible (S) or tolerant (T) allele. Club genotypes are in red and lax in blue. (C) Total number of favorable loci are compared to club versus lax spike morphology.
