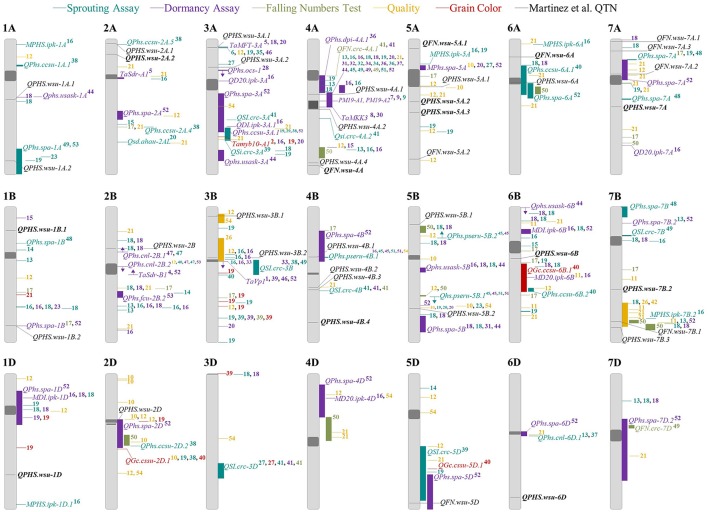
Figure 5.
Chromosome positions of PHS-related loci. Comparative mapping of quantitative trait nucleotides identified in this study (black), and previously published quantitative trait loci (QTL) for PHS tolerance (blue), dormancy (purple), Falling Number (green), grain color (red), and quality (orange). Potentially novel QPHS.wsu or QFN.wsu QTN are in bold. Published QTL were aligned to the Maccaferri et al. (2015) comparative map using the flanking markers or significant associated markers. Chromosomes are presented as a standardized relative length. An arrow along a QTL indicates the QTL direction when only one flanking marker was found in the comparative map. The centromeric region is a dark gray oval. ID numbers to the right of the QTL correspond to the references found in Supplementary Table 3. Illumina 9 or 90 k SNP markers were not reported on chromosome 3D, resulting in an incomplete map.

