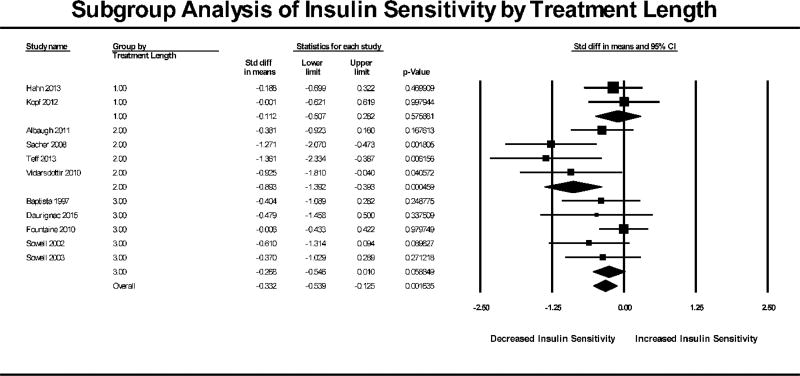
Figure 4. Subgroup Analysis of Insulin Sensitivity by Treatment Length.
Forest plot based on pooled standardized mean differences in insulin sensitivity for each study grouped by significant treatment length. Group 1.0 were single-dose studies, Group 2.0 were studies 13 days and less and Group 3.0 were studies 14 days and longer (max 28 days). Square sizes are proportional to each study’s statistical weight in the meta-analysis. Diamond represents overall estimated effect of AAP on insulin sensitivity for each subgroup and overall.

