Abstract
We introduce a computationally efficient structured low rank algorithm for the reconstruction of two-dimensional infrared (2D IR) spectroscopic data from few measurements. The signal is modeled as a combination of exponential line-shapes, which are annihilated by appropriately chosen filters. The annihilation relations result in a low-rank constraint on a Toeplitz matrix constructed from signal samples, which is exploited to recover the unknown signal samples. Quantitative and qualitative studies on simulated and experimental 2D IR data demonstrate that the algorithm outperforms the discrete compressed sensing algorithm, both in uniform and non-uniform sampling settings.
Two dimensional infrared (2D IR) spectroscopy is an emerging modality that provides detailed information about the dynamic molecular interactions at femtosecond and picosecond timescales [1, 2]. Its ability to probe the molecular vibrational coupling, vibrational and orientational relaxation, as well as chemical exchange and spectral diffusion makes it an attractive tool to investigate systems from dilute solutions to membranes. However, the main challenge with traditional Fourier scanning methods is long acquisition time, which limits the range of investigations. Some applications require measurement of spectra at multiple waiting times further increasing the measurement time. Recently, we and other groups have investigated the use of compressed sensing (CS) algorithms to minimize the sampling burden [3–6]. These methods assume the spectrum to be sparse in the Fourier basis (i.e. signal with few spikes in frequency domain) [4] or piece-wise smooth [7] to make the recovery from sub-Nyquist sampled measurements well-posed. However, the vibrational spectra of many systems often consist of broad peaks. Since several spikes are required to represent a single broad peak, the Fourier representation is non sparse; use of sparsity based CS algorithms to recover the signal from highly undersampled data is challenging. Similar behavior has also been reported in multi dimensional NMR [8], when the peaks are broad.
We propose to represent the spectrum as a sparse linear combination of damped exponentials, each with different frequencies and damping coefficients. Note that this is a richer representation than the Fourier basis (undamped exponentials), which is essentially a subspace of our representation. We observe that a broad peak can be efficiently approximated as a linear combination of a few damped exponentials (Lorentzians in frequency domain) with possibly different damping rates. The approximation of smooth functions as a linear combination of few Lorentzians is well-studied. For example, several authors have shown that the Voigt lineshape can indeed be well approximated by three or four Lorentzians [9, 10].
We recently introduced an algorithm that uses a dictionary of damped exponentials with continuously varying parameters [11–13]. This method significantly reduces discretization errors that are prevalent in CS schemes, where discrete dictionaries with parameters sampled on a uniform grid are used. The proposed algorithm exploits the property that damped exponentials can be annihilated by a filter, parameterized by the frequencies and damping factors [14, 15]. This annihilation property implies that a block Toeplitz matrix (convolution matrix) constructed from the signal samples is low-rank [16]. We formulate the recovery of the time domain samples of the signal from its non-uniform samples as a Toeplitz structured low-rank recovery problem. We re-engineer our recent algorithm termed Generic Iteratively Reweighted Annihilating Filter (GIRAF) [12, 17] to solve the optimization problem in a reasonable computation time.
In this paper, we use simulated 2D IR data to demonstrate the qualitative and quantitative performance of the algorithm. The results clearly show the benefit of GIRAF over conventional CS methods. We also show that non-uniform undersampling provides lower errors than the uniform sampling setting for GIRAF, consistent with prior results for the CS method. Finally, we also apply the method to experimental measurements of cyanate anion in methanol where the GIRAF algorithm enables nearly exact recovery of experimental data from only 12.5% of the samples that were collected in the original data set.
2D IR is a third-order nonlinear spectroscopy technique that uses multiple femtosecond laser pulses to interact with a sample. The response of the sample depends on the timing and geometry of the interactions. We perform our experiments in the pump-probe beam geometry with the first two pulses, produced by pulse shaping, acting collectively as the pump pulse and the third pulse as the probe. The time delay between pump and probe pulses is denoted by T and is known as the waiting time. The probe also serves as the local oscillator, which we detect by upconverting into the visible and dispersing in a spectrometer for detection in the frequency domain by an array detector. Thus, the response in the ω3 axis is read off the spectrometer directly on every laser shot, and the coherence time is varied by programming the pulse shaper. A Fourier transform of the interfereogram in τ yields the response in the ω1 axis. Eq. 1 gives the 2D spectra where XT(τ, t) is the time domain signal at a specific waiting time T.
| (1) |
In our experiments, 1024 points along ω3 are read off the array on every laser shot. Around 160–170 different values of τ are collected, followed by apodization and zero-padding to acquire ω1, and we construct a 2D IR spectrum of size 512 x 1024. For a sample with a strong chromophore and high concentration, a single 2D IR spectrum at a given waiting time can be acquired in less than one second, though it is common to average thousands of these spectra to obtain a good signal-to-noise ratio (SNR). For many systems, these acquisitions are repeated several times for each T for signal averaging, and must be collected for various waiting times, leading to experiments that can take up to several days. We propose to undersample the τ axis and collect much less than 167 readings and recover the spectra using GIRAF, which should considerably reduce the total number of measurements required and thus the overall measurement time.
We will first explain the idea in the 1-D setting, before generalizing to 2-D. Consider the samples of a 1-D damped exponential signal x(n) = exp(βnS); n = 0, 1, ..N, where β is the exponential parameter and S is the sampling interval. We note that if the real part of β is zero, then the signal is an undamped exponential. The key observation is that x(n) is linearly predictable:
| (2) |
The above relation can also be expressed as x * hβ = 0, where * denotes discrete convolution and hβ is a filter with coefficients [1,−exp(βS)]. Since the filter kills the signal, hβ[n] is termed as the annihilation filter. When the signal is a linear combination of exponentials with parameters βk; k = 1, .., K, it still can be annihilated by the filter h = hβ1 * hβ2* …hβK. This annihilation relation can be compactly written as a matrix product
| (3) |
where 𝒮K(x) is the structured convolution matrix. In reality, the number of exponentials in the signal are not known apriori. In this case, one can over-estimate K, when it can be shown that the matrix 𝒮K(x) is low-rank. This low-rank compactness prior on the structured matrix 𝒮K(x), which is derived from the signal x, is used to recover the signal from its undersampled measurements [11–13].
For a specific waiting time, we model the 2D IR signal as the sum of K two dimensional (damped) exponentials:
| (4) |
sampled on the subset of a uniform grid [τ, t] of size M × N; τ = 0, λ, ..(M−1)λ; t = 0, η, ..(N −1)η. Here, ck are the weights of the kth exponential, while αk and βk are the exponential parameters. Note that this model is equivalent to expressing the spectrum as a linear combination of K Lorentzian functions. As described earlier, smooth spectra such as Voigt profiles can be well-approximated as a linear combination of Lorentzian functions [9, 10].
Similar to the 1-D setting, the sk(τ, t) can be annihilated (sk * hk = 0) by convolution with the filter hk, where
| (5) |
Similar to the 1-D setting, this annihilation relation implies that the block Toeplitz matrix 𝒮 (XT), constructed out of the uniform samples XT(λm, ηn) is low-rank. We now use the above low-rank property to recover the unknown entries of XT, when only a few samples are available:
| (6) |
Here, sl ; l = 1, .., L are the measured samples of XT. In particular, we search for Y whose samples at sl match the measurements and the matrix 𝒮 (Y) has the Schatten p norm, which is a convex surrogate for the rank. We relax the combinatorial problem in Eq. (6) to obtain:
| (7) |
Here, 𝒜 is an operator which extracts the samples of Y at the locations sl ; l = 1, .., L and b is the length L vector of measured samples. We use the iterative reweighted least squares algorithm [18] to solve the above problem. The final spectrum is obtained by Fourier transformation of the reconstructed Y.
We compare the performance of the proposed method against standard CS methods as in our previous work [3]. We consider both the uniform sampling setting, where data is collected for a few consecutive values of τ, and the algorithm aims to recover it at a higher resolution, and the non uniform setting where the same number of τ samples are collected but with pseudorandom delays. Previous studies have looked at recovery of exponentials using structured low rank matrices [14–16] from uniformly sampled data; in this work we compare the performance of GIRAF for uniform and non-uniform sampling. We use two different datasets for our comparison: 1) simulated data using a Kubo lineshape model, 2) experimental 2D IR data for cyanate anion in methanol.
We simulate a purely absorptive 2D spectrum of a 3-level system with a Kubo lineshape model [1], where the fluctuation amplitude is 2 ps−1, the anaharmonicity is 10 ps−1, the correlation time is 1.5 ps and the peak is centered at 10 ps−1 which is later frequency shifted by 1800 cm−1. The waiting time is chosen to be 0 ps.
We perform two studies of the simulated data: uniformly and non-uniformly undersampled reconstruction. We also test the robustness of GIRAF in presence of artificially added noise. We added gaussian noise to the time domain data before performing reconstruction. Three different noise levels of SNR 20, 25 and 33 dB are tested. We performed 100 noise realizations at each SNR level and performed fits on them. In each case, we compare the results for GIRAF and conventional CS algorithm [3].
We collected 2D IR data from a sample of 50 mM sodium cyanate in methanol held in a sample cell with a 50 μm path length. The apparatus has been described in detail previously [19], but the most important features are that we have approximately 1 μJ of pump light at the sample and the pump and probe pulses focus to a spot size of approximately 60 μm. At a waiting time of T = 0 ps, we scan τ from 0 – 4 ps with 24 fs size steps, which is a fully sampled signal because we use phase-increment frequency shifting in our pulse shaper to work in the rotating frame, resulting in 167 τ values. The fully sampled data is then retrospectively, non-uniformly undersampled. We compare the reconstructed experimental data using the proposed method and the conventional CS recovery.
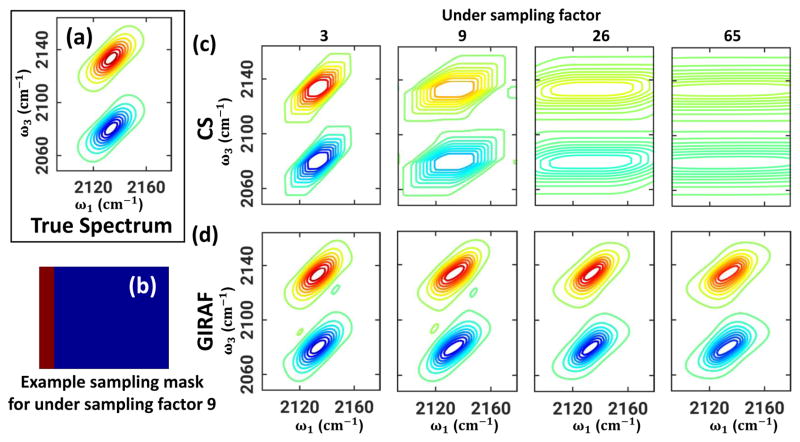
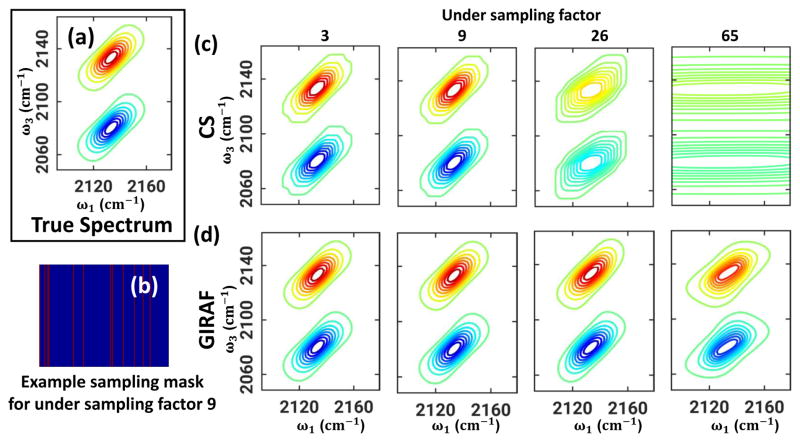
The reconstructed spectra for the simulated data with uniform and non-uniform sampling patterns are shown in Fig. 1 and Fig. 2, respectively. The true spectrum in Fig. 1 & 2(a) is obtained by Fourier transforming the fully sampled data. Example masks for undersampling factor 9 are shown in Fig. 1 & 2(b) for uniform and non-uniform sampling where the sampled locations are marked in red. Reconstruction using CS and GIRAF are shown in the first (c) and second (d) row, respectively. The CS method strives to recover the fewest non-zero spectral intensities, thus resulting in distorted lineshapes at higher undersampling rates, mainly due to the inability of the representation to capture the signal with few data points. GIRAF recovers the line shapes with high fidelity. The performances of both methods are superior in the non-uniform sampling case as is expected, because the coherent undersampling artifacts from uniform sampling are much greater than the incoherent artifacts from pseudo-random undersampling. We fit the results to a 2D Gaussian lineshape for quantitative comparison (the fitting model is explained in ref [3]). In Fig.3 we demonstrate the ability of GIRAF and CS to recover lineshape details at different undersampling factors and SNR levels. We experimented on 100 noise realizations for every undersampling factor and SNR level and have reported the mean and standard deviation of the line fit parameters. Peak amplitudes are suppressed with increasing undersampling, which is much worse for CS. The center and width of peaks are reported only for the dimension that is undersampled. The fit results reveal GIRAF has superior performance to CS. Even in presence of noise we observe the performance of GIRAF is highly reliable especially for non-uniform undersampling. The correlation parameter, in case of GIRAF, slightly increases before decreasing at higher undersampling for uniform setting and shows more stable behavior in the nonuniform setting, in contrast to CS where it monotonically decreases. Thus it can be concluded that the proposed method is quite robust even in the presence of noise. It quantitatively recovers lineshapes up to undersampling factor of 26 i.e. only 3.8% of the samples. Even at undersampling factor of 65, i.e. only 2 τ lines, the GIRAF reconstruction results in only a 15% error in the correlation parameter.
Fig. 1.
Uniformly sampled recovery of simulated data: (a)True 2D spectrum. (b) Example uniform sampling mask for undersampling factor 9; sampled and non-sampled locations are marked in red and blue. (c) Reconstructions using compressed sensing (CS) algorithm and (d) GIRAF at various undersampling factors.
Fig. 2.
Non-uniformly undersampled recovery of simulated data: (a)True 2D spectrum. (b) Example non-uniform sampling mask for undersampling factor 9; sampled and non-sampled locations are marked in red and blue. (c) Reconstructions using compressed sensing (CS) algorithm and (d) GIRAF at various undersampling factors.
Fig. 3.
Simulated Data 2D Gaussian fits at different noise levels: Fit parameters for uniform and non-uniform undersampling are shown for CS and GIRAF reconstruction. 100 experiments per noise realization were performed. Mean and standard deviation of the fit results are plotted. CS parameters degrade rapidly with increasing acceleration whereas the degradation of GIRAF fits is remarkably less. Note that the non-uniform setting performs better than uniform setting.
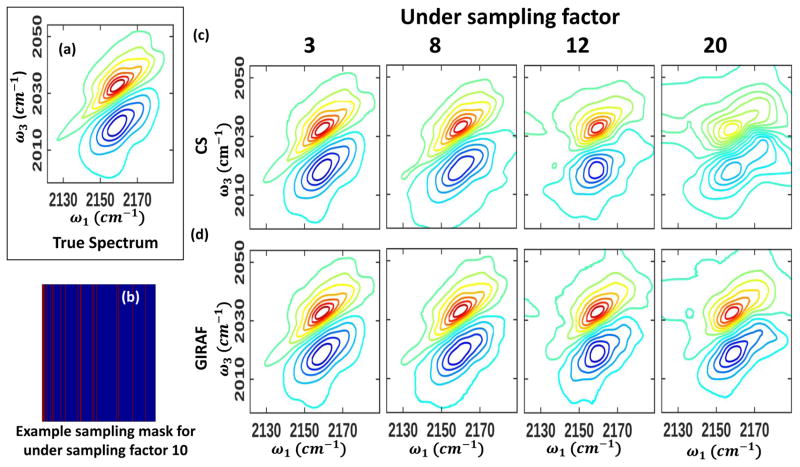
Due to the superior performance of non-uniform sampling, we restrict our analysis to this setting for the experimental data. The true spectrum is shown in Fig. 4(a) and an example sampling mask for factor 10, with sampled locations in red, is shown in (b). Similar to the simulated case, the performance of CS method (c) is compromised at high compression factors. GIRAF (d) recovers the lineshapes with almost no distortion up to an undersampling factor of 8, i.e. only 12.5% of the fully sampled measurements, thus performing reasonably even at higher undersampling.
Fig. 4.
Non-uniformly undersampled recovery of experimental 2D IR data: (a)The fully sampled 2D spectrum is recovered from 167 τ points. (b) Example non-uniform sampling mask of undersampling factor 10 where sampled locations are marked in red and non-sampled locations in blue. (c) Performance of compressed sensing (CS) algorithm and (d) GIRAF at various undersampling factors.
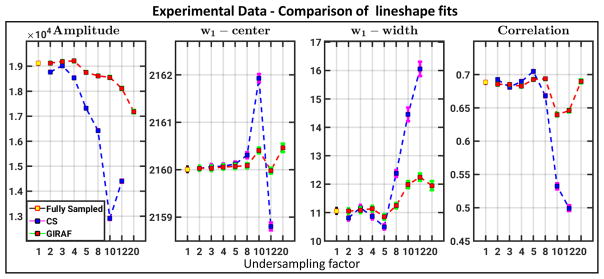
Fig. 5 shows a quantitative comparison of CS and GIRAF 2DGaussian fit parameters. GIRAF lineshape parameters are within ±10% of the true data up to an undersampling factor of 20. CS fits, however, significantly deviate from the true fits beyond an undersampling factor of 5. For experimental data, which has more complicated lineshape than simulated data, GIRAF exhibits superior recovery.
Fig. 5.
Gaussian fit comparisons for experimental data: Fit parameters for CS and GIRAF reconstructions are shown. Error bars represent 95% confidence bounds. CS reconstruction for undersampling factor 20 are not reported in the plot because it could not be fitted to the model due to severe distortion of the lineshape. Lineshape fits for CS reconstruction degrade rapidly with increasing acceleration factor whereas the GIRAF results are within ± 10% of the true fits.
In summary, we introduced a novel method to reconstruct 2D IR data from few measurements. The proposed algorithm models the signal as a linear combination of damped exponentials. The algorithm exploits the low rank structure of a Toeplitz matrix, whose entries are samples of the linear combination of exponentials, and is capable of recovering the missing samples in the signal from heavily undersampled measurements. Our results show that the lineshapes are adequately preserved for quantitative analysis, with as few as 3.8% and 8% samples for the simulated and experimental data respectively. This letter introduces a very promising method with the potential to accelerate 2D IR considerably. However detailed analyses of the method and applications are crucial and would be addressed in a follow-up study in a later publication.
Acknowledgments
Funding: NIH 1R01EB019961-01A1 and ONR N00014-13-1-0202 (MJ) and NSF CHE-1361765 (CMC)
Footnotes
OCIS codes: (300.6340) 2D IR spectroscopy, (070.7145 ) Ultrafast processing, structured low-rank recovery
FULL REFERENCES
- 1.Hamm P, Zanni M. Concepts and methods of 2D infrared spectroscopy. Cambridge University Press; 2011. [Google Scholar]
- 2.Hamm P, Lim M, Hochstrasser RM. Structure of the amide i band of peptides measured by femtosecond nonlinear-infrared spectroscopy. The Journal of Physical Chemistry B. 1998;102:6123–6138. [Google Scholar]
- 3.Humston JJ, Bhattacharya I, Jacob M, Cheatum CM. Compressively sampled two-dimensional infrared spectroscopy that preserves lineshape information. The Journal of Physical Chemistry. doi: 10.1021/acs.jpca.7b01965. [DOI] [PubMed] [Google Scholar]
- 4.Dunbar JA, Osborne DG, Anna JM, Kubarych KJ. Accelerated 2D-IR using compressed sensing. The Journal of Physical Chemistry Letters. 2013;4:2489–2492. [Google Scholar]
- 5.Sanders JN, Saikin SK, Mostame S, Andrade X, Widom JR, Marcus AH, Aspuru-Guzik A. Compressed sensing for multidimensional spectroscopy experiments. The journal of physical chemistry letters. 2012;3:2697–2702. doi: 10.1021/jz300988p. [DOI] [PubMed] [Google Scholar]
- 6.Almeida J, Prior J, Plenio M. Computation of 2-d spectra assisted by compressed sampling. 2012 doi: 10.1021/jz3009369. arXiv preprint arXiv:1207.2404. [DOI] [PubMed] [Google Scholar]
- 7.Ye JC, Kim JM, Jin KH, Lee K. Compressive sampling using annihilating filter-based low-rank interpolation. IEEE Transactions on Information Theory. 2016 [Google Scholar]
- 8.Qu X, Mayzel M, Cai JF, Chen Z, Orekhov V. Accelerated NMR Spectroscopy with Low-Rank Reconstruction. Angewandte Chemie International Edition. 2015;54:852–854. doi: 10.1002/anie.201409291. [DOI] [PubMed] [Google Scholar]
- 9.Martin P, Puerta J. Generalized lorentzian approximations for the voigt line shape. Applied optics. 1981;20:259–263. doi: 10.1364/AO.20.000259. [DOI] [PubMed] [Google Scholar]
- 10.Puerta J, Martin P. Three and four generalized lorentzian approximations for the voigt line shape. Applied optics. 1981;20:3923–3928. doi: 10.1364/AO.20.003923. [DOI] [PubMed] [Google Scholar]
- 11.Balachandrasekaran A, Ongie G, Jacob M. 2016 IEEE International Conference on Image Processing (ICIP); IEEE; [DOI] [PMC free article] [PubMed] [Google Scholar]
- 12.Ongie G, Jacob M. Sampling Theory and Applications (SampTA). 2015 International Conference on; IEEE; [Google Scholar]
- 13.Ongie G, Jacob M. 2015 IEEE 12th International Symposium on Biomedical Imaging (ISBI); [DOI] [PMC free article] [PubMed] [Google Scholar]
- 14.Stoica P, Moses RL. Introduction to spectral analysis. Vol. 1. Prentice hall Upper Saddle River; New Jersey, USA: 1997. [Google Scholar]
- 15.Cheng Q, Yingbo H. In: A review of parametric high-resolution methods, High-resolution and robust signal processing. Yingbo H, Gershman A, Cheng Q, editors. Marcel Dekker; 2003. [Google Scholar]
- 16.Chen Y, Chi Y. Robust spectral compressed sensing via structured matrix completion. IEEE Trans Inf Theory. 2014;60:6576–6601. [Google Scholar]
- 17.Ongie G, Jacob M. 2016 IEEE 13th International Symposium on Biomedical Imaging (ISBI); IEEE; [DOI] [PMC free article] [PubMed] [Google Scholar]
- 18.Fornasier M, Rauhut H, Ward R. Low-rank matrix recovery via iteratively reweighted least squares minimization. SIAM J Optimization. 2011;21:1614–1640. [Google Scholar]
- 19.Rock W, Li YL, Pagano P, Cheatum CM. 2d ir spectroscopy using four-wave mixing, pulse shaping, and ir upconversion: a quantitative comparison. The Journal of Physical Chemistry A. 2013;117:6073–6083. doi: 10.1021/jp312817t. [DOI] [PMC free article] [PubMed] [Google Scholar]


