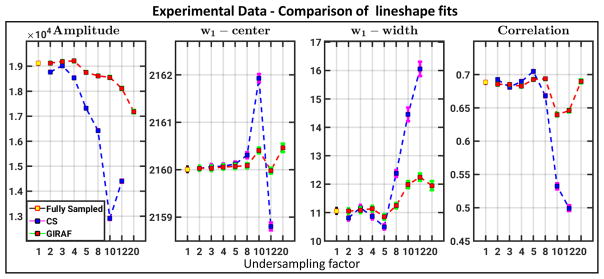
Fig. 5.
Gaussian fit comparisons for experimental data: Fit parameters for CS and GIRAF reconstructions are shown. Error bars represent 95% confidence bounds. CS reconstruction for undersampling factor 20 are not reported in the plot because it could not be fitted to the model due to severe distortion of the lineshape. Lineshape fits for CS reconstruction degrade rapidly with increasing acceleration factor whereas the GIRAF results are within ± 10% of the true fits.

