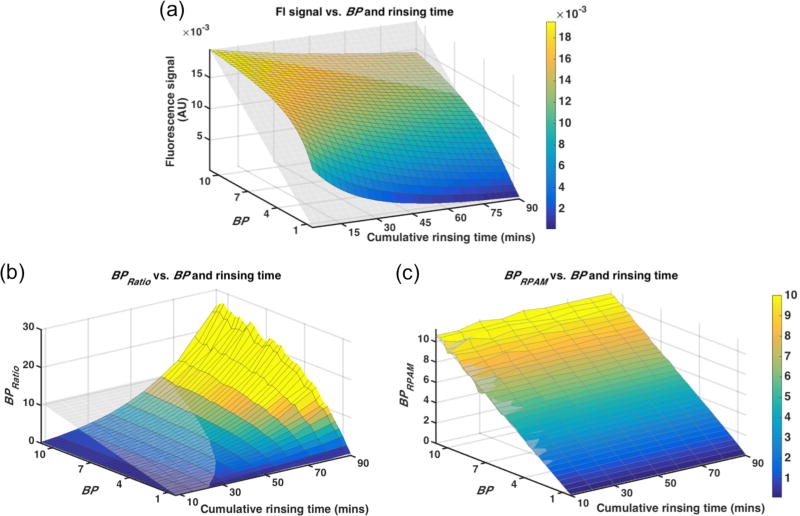
Figure 5.
Simulation of BP (receptor concentration) estimation using (a) raw fluorescence signal, (b) BPRatio and (c) BPRPAM as a function of different BP inputs and rinsing durations. The coloured surface is the simulated data and the transparent mesh is: (a) the expected signal distribution, (b, c) the BP input map. Colour bar is set to be the same for panel (b) and (c) to compare the estimated BP value.

