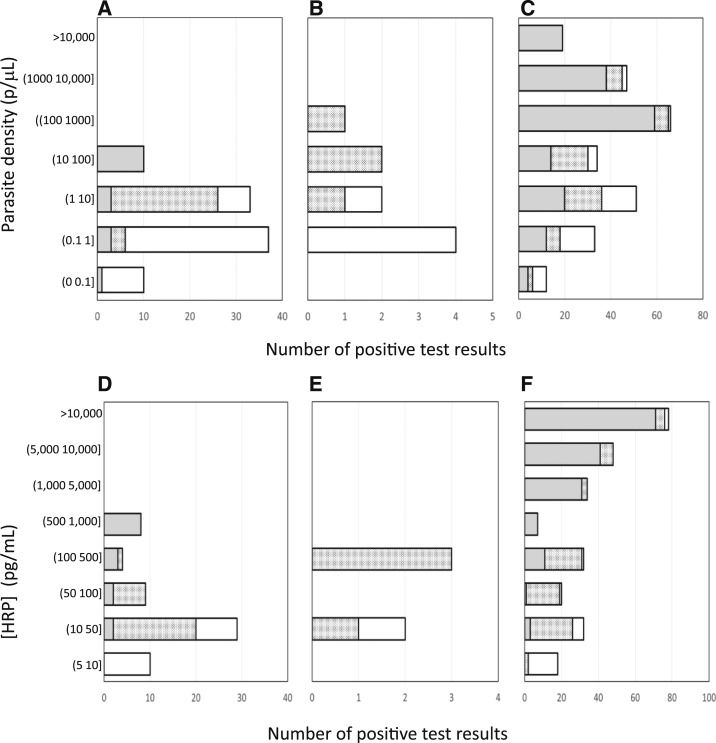
Figure 2.
Distribution of specimens by parasite density and histidine-rich protein II (HRP2) concentration in induced blood-stage malaria challenge studies (A, D); Myanmar study (B, E); and Uganda study (C, F). (A–C). The outer clear bars represent the specimens that were positive by quantitative reverse transcription polymerase chain reaction; overlaid are the number of positive test results by ultra sensitive rapid diagnostic test (uRDT) (checkered bars) and by RDT (gray bars). (D–F). The outer clear bars represent the specimens that were positive by quantitative HRP2 assay; overlaid are the number of positive test results by uRDT (checkered bars) and by RDT (gray bars).

