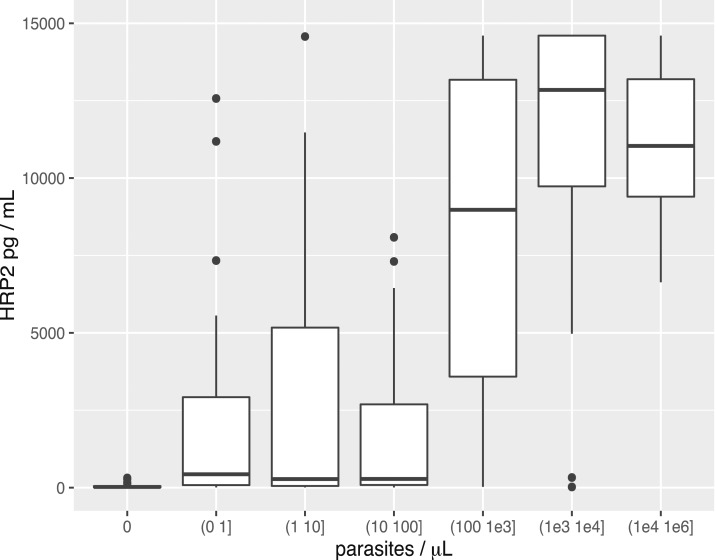
Figure 3.
Relationship between parasite density and histidine-rich protein II (HRP2) concentration shown as box plots for ranges of parasite densities. The data shown are for the Uganda specimens. The upper and lower bounds of the boxes represent the third and first quartiles, respectively. The mean is indicated by a solid line and the whiskers indicate the 95th and 5th percentiles. The leftmost bin for 0 parasites per µL (p/µL) corresponds to HRP2-positive but quantitative reverse transcription polymerase chain reaction-negative specimens. The descriptive statistics are provided in Table 3.

