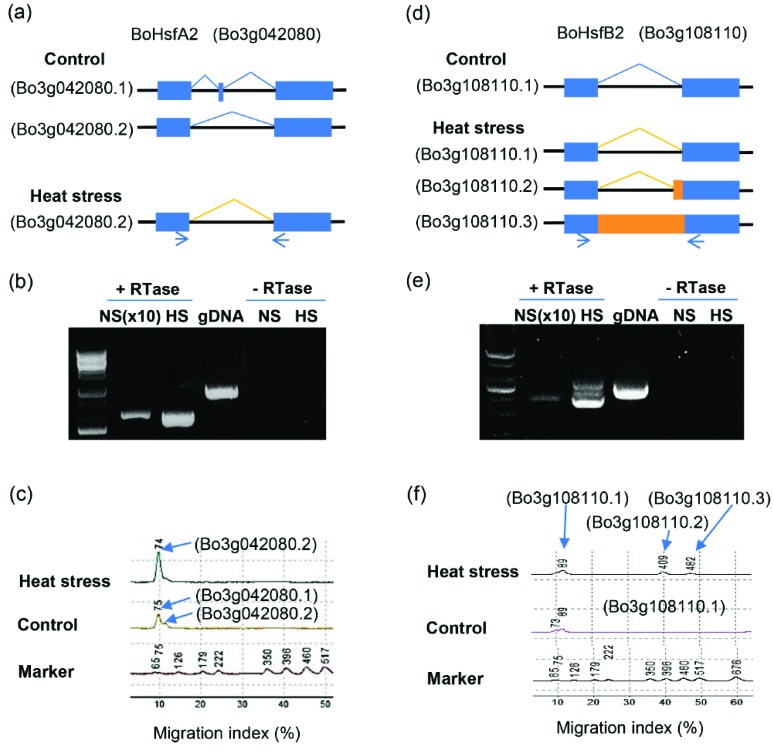
Fig. (7).
Validation of alternative splicing events at the BoHsfA2 and BoHsfB2 loci. (a, d) Gene structures and transcripts of BoHsfA2 and BoHsfB2. Exons, introns, and constitutively (with no stress)/alternatively (with heat stress) spliced regions are represented by boxes, black lines, and blue/orange lines, respectively. (b, e) RT-PCR of BoHsfA2 and BoHsfB2. NS/HS indicates no stress/heat stress. PCR of samples under NS used 10-fold (×10) amounts of template compared with those under HS. (c, f) AS transcript patterns determined using MultiNA. (For interpretation of the references to color in this figure legend, the reader is referred to the web version of this paper.)

