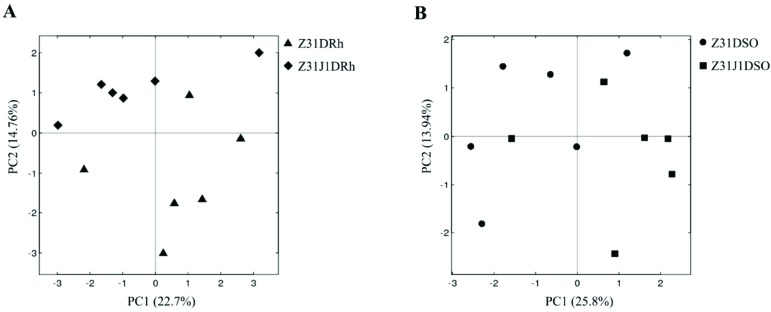
Fig. (1).
Principal Component Analysis (PCA) based on OTU abundances of bacterial communities. X-axis was 1st principal component and Y-axis was 2nd principal component. Numbers in brackets represented contributions of principal components to the total variance. A) The black rhombuses and black triangles represented rhizosphere soil replicates of the glyphosate treated Z31J1 and its control Z31, respectively. B) The black squares and the black solid circles represented surrounding soil replicates of glyphosate treated Z31J1 and its control Z31, respectively.

