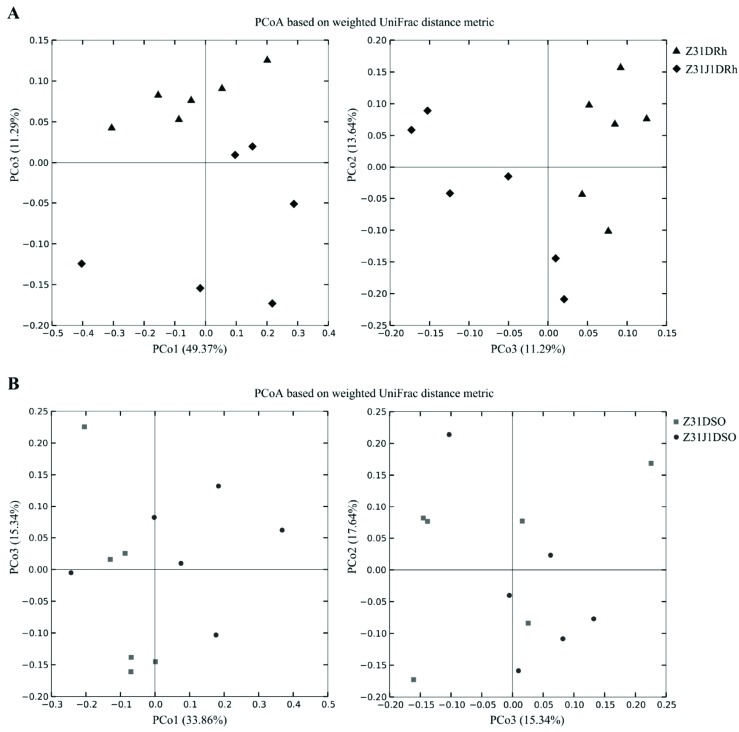
Fig. (2).
Principal Coordinate Analysis (PCoA) based on weighted UniFrac distance. The variance explained by each principal coordinate axis was shown in PCo1 vs. PCo3 and PCo3 vs. PCo2. A) The black rhombuses and black triangles represented rhizosphere soil replicates of the glyphosate treated Z31J1 and its control Z31, respectively. B) The black dots and the dark gray squares represented surrounding soil replicates of glyphosate treated Z31J1 and its control Z31, respectively.

