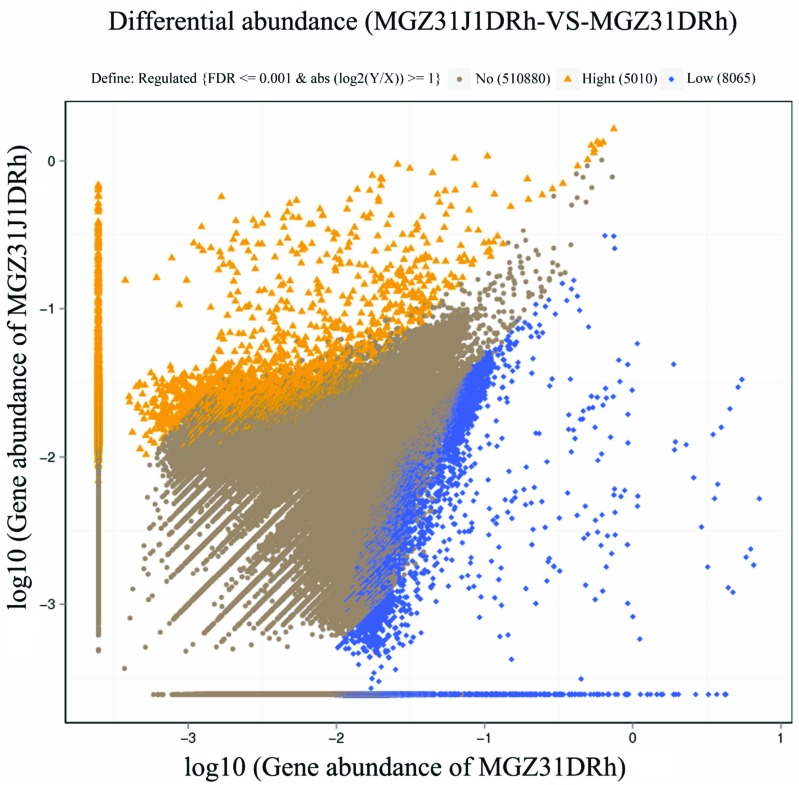
Fig. (3).
Scatter plots of genes with differential abundance. Y and X axis presented value of genes abundance of MGZ31J1DRh and of MGZ31DRh, respectively, based on the assembled data by IDBA-UD. Orange triangles and blue rhombuses indicated genes with significantly higher and lower relative abundance in MGZ31J1DRh, respectively. Brown circles indicate those genes with no significant difference between MGZ31J1DRh and MGZ31DRh. The criterion of screening is on top of the plot. (For interpretation of the references to color in this figure legend, the reader is referred to the web version of this paper.)

